Fig. 10.
Download original image
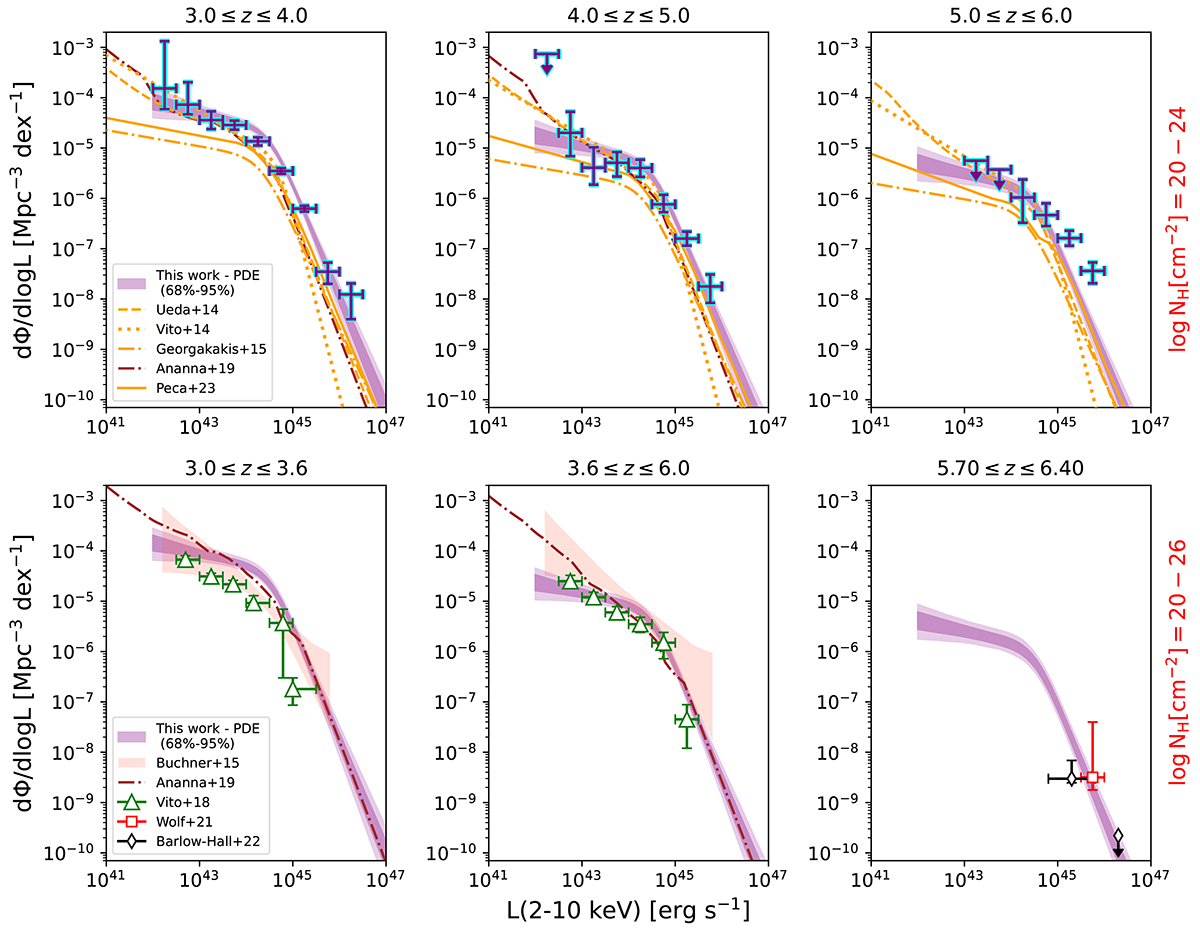
Best-fitting PDE model in several redshift bins computed by integrating the XLF over redshift and column density. The purple shaded regions represent the 68% and 95% confidence intervals of the model, while the purple data points indicate the binned luminosity function. Our results are compared with the parametric forms of the XLF derived by previous X-ray studies (Ueda et al. 2014; Vito et al. 2014; Georgakakis et al. 2015; Peca et al. 2023) in the column density interval of log NH = 20 − 24 (upper panels). Also shown is our XLF integrating over log NH = 20 − 26 (lower panels) to the results of Buchner et al. (2015), Vito et al. (2018), Wolf et al. (2021), Barlow-Hall et al. (2023). The XLF of Buchner et al. (2015) in the first two panels are derived in the redshift range 3.2 ≤ z ≤ 4.0 and 4.0 ≤ z ≤ 7.0, respectively. Our PDE model at the last panel is extrapolated at z = 6.05. The brown dash-dotted lines show the predicted XLF derived by Ananna et al. (2019).
Current usage metrics show cumulative count of Article Views (full-text article views including HTML views, PDF and ePub downloads, according to the available data) and Abstracts Views on Vision4Press platform.
Data correspond to usage on the plateform after 2015. The current usage metrics is available 48-96 hours after online publication and is updated daily on week days.
Initial download of the metrics may take a while.