Open Access
Fig. 5
Download original image
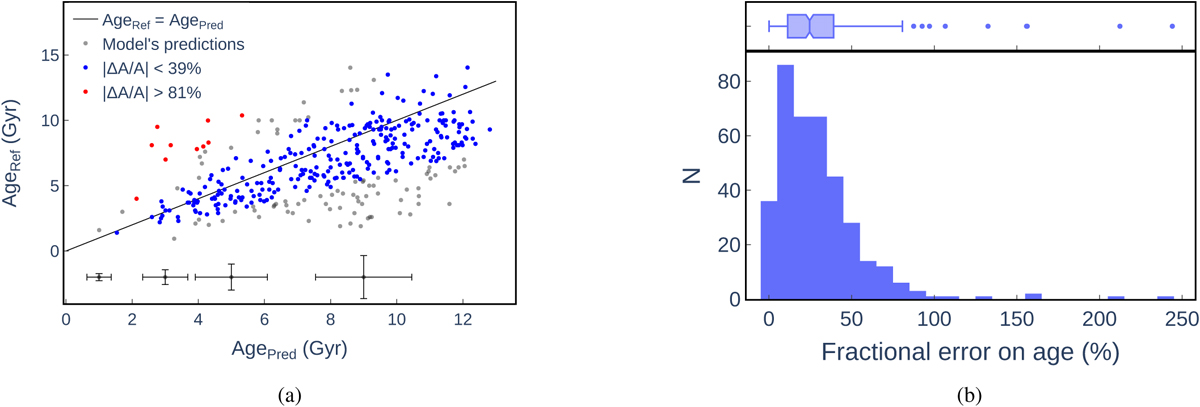
Ensemble of plots summarising the performance of the model on the K2-GALAH sample. Panel a: plot of the scatter between the predicted ages and reference ages. The black line serves to visualise the residuals. Panel b: histogram of the absolute residuals between the predicted ages and the reference ages in absolute value.
Current usage metrics show cumulative count of Article Views (full-text article views including HTML views, PDF and ePub downloads, according to the available data) and Abstracts Views on Vision4Press platform.
Data correspond to usage on the plateform after 2015. The current usage metrics is available 48-96 hours after online publication and is updated daily on week days.
Initial download of the metrics may take a while.