Fig. 3
Download original image
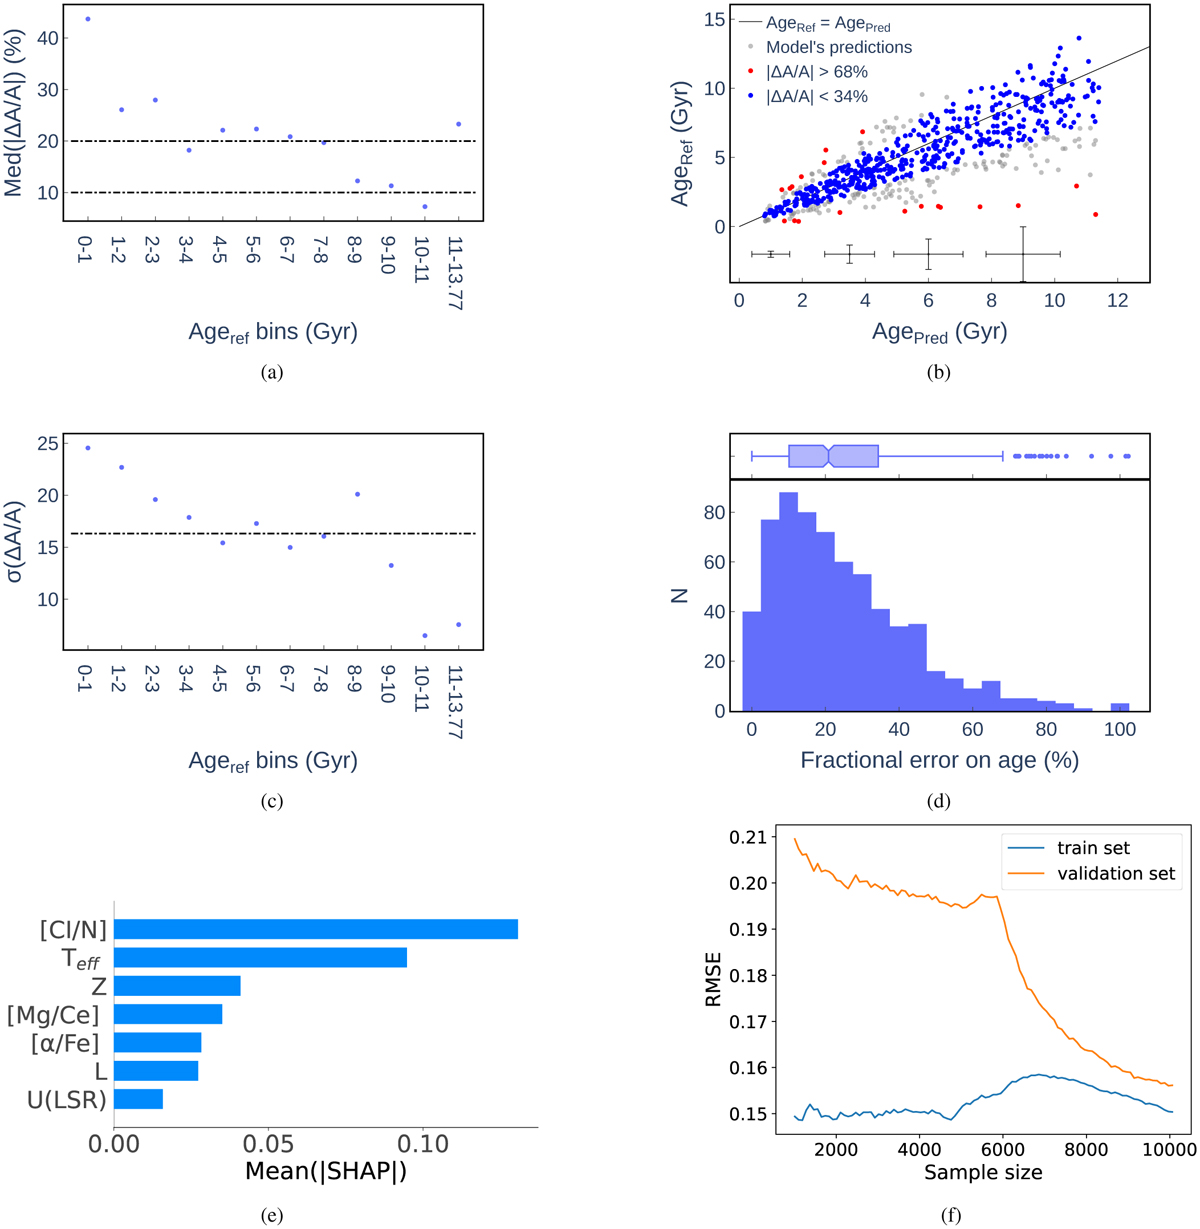
Ensemble of plots summarising the final performances on the MCK-APOKASC training-test sample. Panel a: evolution of the median of the absolute value for the fractional error on age per bin. Panel b: comparison of the ages of reference and those predicted by the model. The black line is the identity function ∣ΔA/A∣is the absolute fractional error on age. The black error bars represent the means of the errors in age. Panel c: evolution of the standard deviation of the fractional error on age per bin. The vertical-horizontal bar depicts the mean value for the whole age range. Panel d: histogram of the absolute fractional error on age. Panel e: bar plot of the feature importance for all the retained features. Panel f: Plot of the learning curves.
Current usage metrics show cumulative count of Article Views (full-text article views including HTML views, PDF and ePub downloads, according to the available data) and Abstracts Views on Vision4Press platform.
Data correspond to usage on the plateform after 2015. The current usage metrics is available 48-96 hours after online publication and is updated daily on week days.
Initial download of the metrics may take a while.