Open Access
Fig. 8.
Download original image
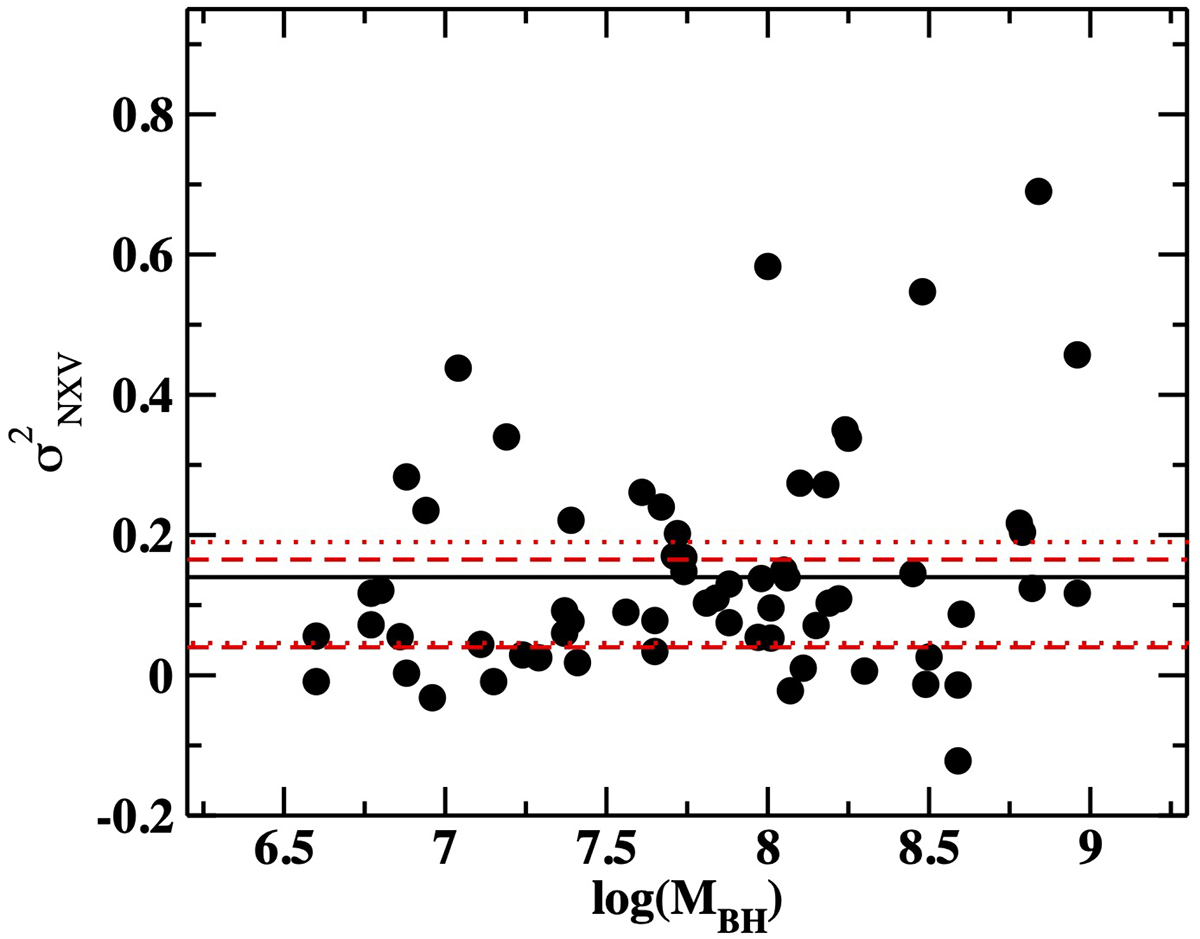
![]() versus log(MBH) for the AGN in the various boxes plotted in Fig. 6. The solid black line indicates the mean excess variance, while the dashed-dotted and dashed lines indicate the expected variance in the case when the PSD in all AGN has a slope of −1 or −0.75, respectively.
versus log(MBH) for the AGN in the various boxes plotted in Fig. 6. The solid black line indicates the mean excess variance, while the dashed-dotted and dashed lines indicate the expected variance in the case when the PSD in all AGN has a slope of −1 or −0.75, respectively.
Current usage metrics show cumulative count of Article Views (full-text article views including HTML views, PDF and ePub downloads, according to the available data) and Abstracts Views on Vision4Press platform.
Data correspond to usage on the plateform after 2015. The current usage metrics is available 48-96 hours after online publication and is updated daily on week days.
Initial download of the metrics may take a while.