Fig. 7.
Download original image
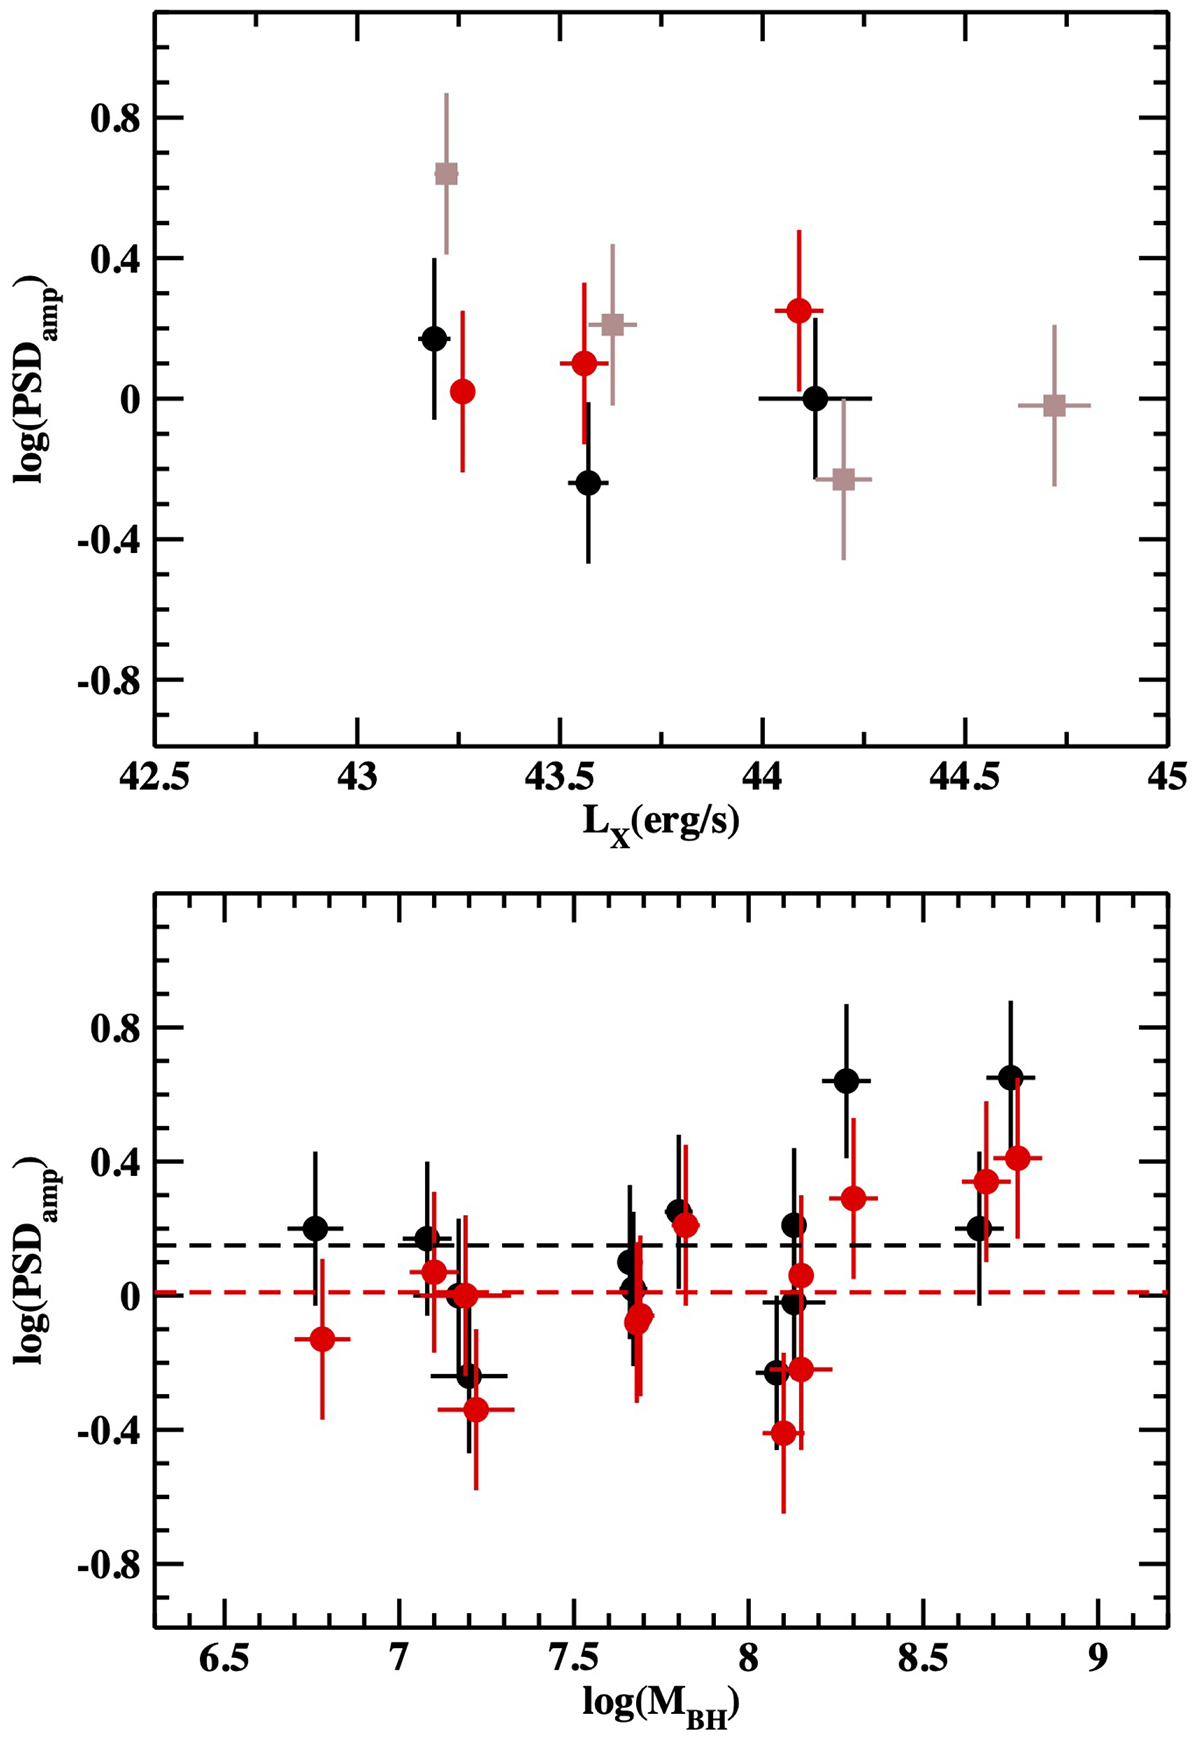
Same as in Fig. 5 but for the PSD amplitude. The black, red, and brown points in the upper panel show the LF best-fit log(PSDamp) values plotted as a function of LX for AGN in the B′, C′, and D′ boxes in Fig. 6. The bottom panel shows all the LF and FR PSD amplitudes (listed in Table 2) plotted as a function of MBH (black and red points, respectively). The dashed lines indicate the respective mean PSD amplitudes.
Current usage metrics show cumulative count of Article Views (full-text article views including HTML views, PDF and ePub downloads, according to the available data) and Abstracts Views on Vision4Press platform.
Data correspond to usage on the plateform after 2015. The current usage metrics is available 48-96 hours after online publication and is updated daily on week days.
Initial download of the metrics may take a while.