Fig. 5.
Download original image
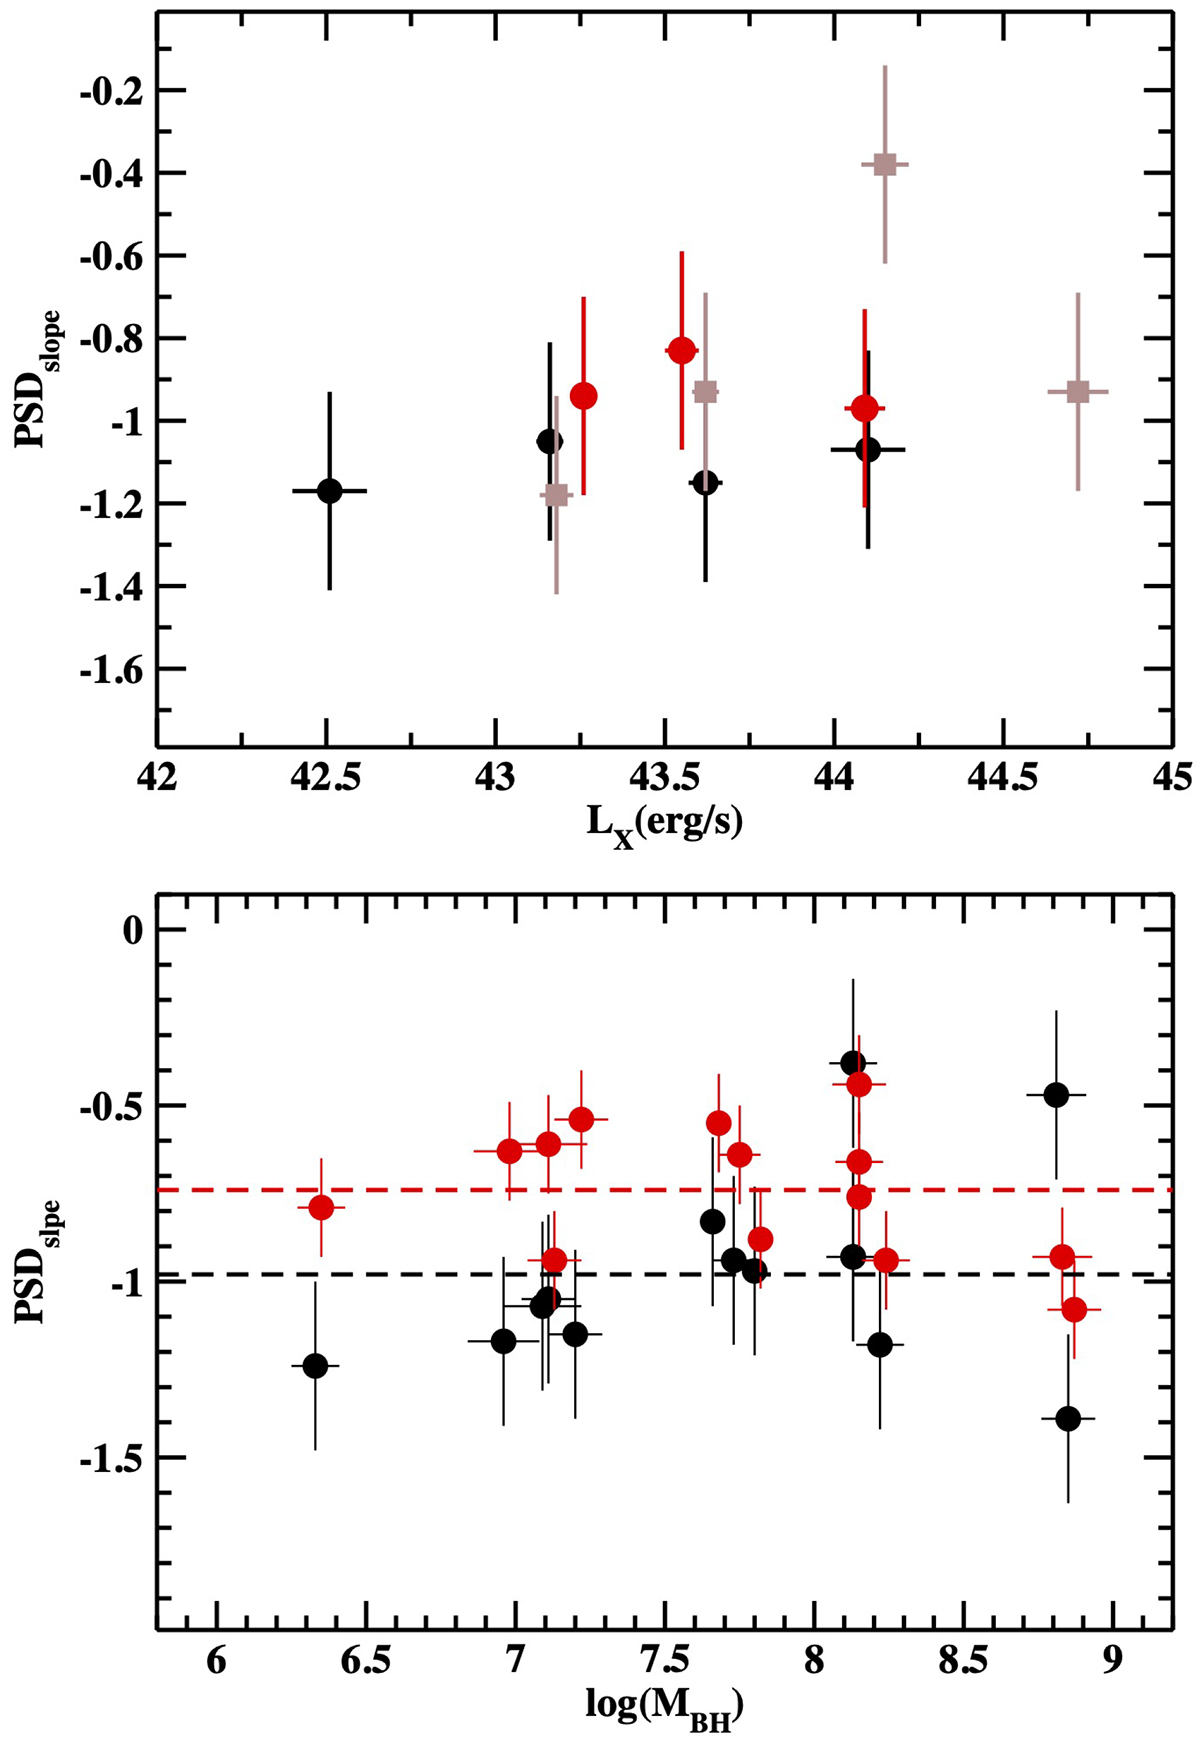
Dependence of the PSD slope on X-ray luminosity and the BH mass. Upper panel: LF best-fit PSDslope plotted as function of log(LX) for the B, C, and D groups (black circles, red circles, and brown squares, respectively). Bottom panel: LF and FR PSDslope plotted as a function of ![]() . The black and red dashed lines indicate the mean LF and FR slopes, respectively.
. The black and red dashed lines indicate the mean LF and FR slopes, respectively.
Current usage metrics show cumulative count of Article Views (full-text article views including HTML views, PDF and ePub downloads, according to the available data) and Abstracts Views on Vision4Press platform.
Data correspond to usage on the plateform after 2015. The current usage metrics is available 48-96 hours after online publication and is updated daily on week days.
Initial download of the metrics may take a while.