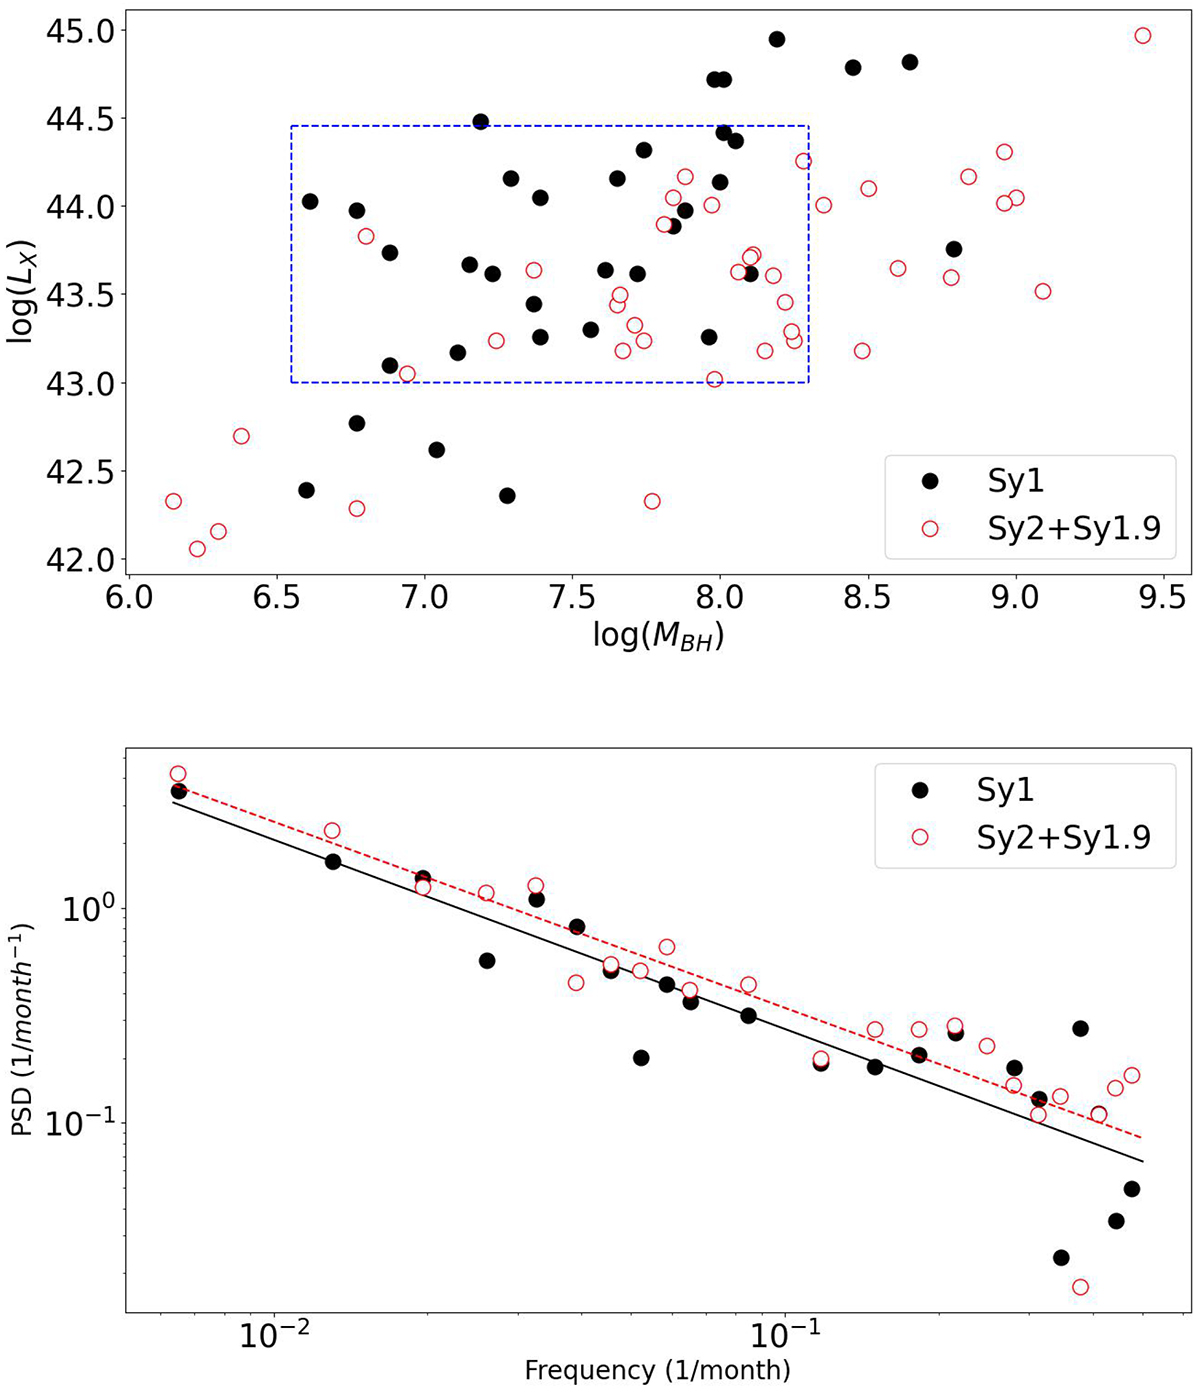
Fig. 3.
Download original image
Comparison between the Seyfert I and Seyfert II PSDs. Upper panel: Plot of log(LX), versus log(MBH) for the variable sources in the sample. Black and red circles indicate data for the Sy1 and Sy2 galaxies, respectively. The mean BH mass and LX of the Sy1 and Sy2 sources in the dashed box are similar. Lower panel: Mean PSD of all the Sy1 and Sy2 AGNs with similar luminosity and BH mass. Black and red points show the ensemble PSD of the Sy1 and Sy2 galaxies, which are in the dashed box drawn in the upper panel. Black and red dashed lines show the best-fit line to the PSDs.
Current usage metrics show cumulative count of Article Views (full-text article views including HTML views, PDF and ePub downloads, according to the available data) and Abstracts Views on Vision4Press platform.
Data correspond to usage on the plateform after 2015. The current usage metrics is available 48-96 hours after online publication and is updated daily on week days.
Initial download of the metrics may take a while.