Fig. 8.
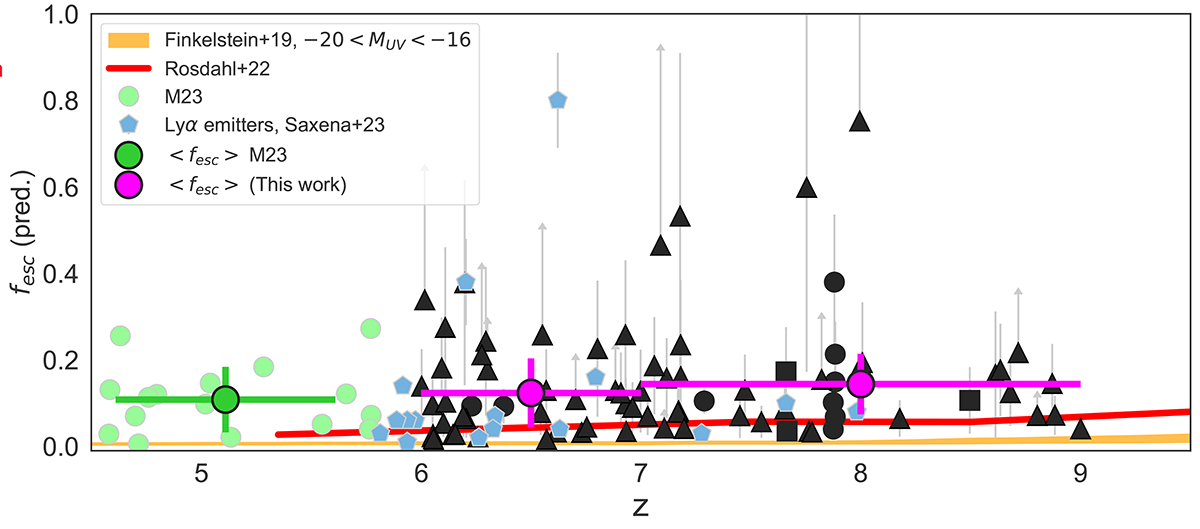
Download original image
Predicted fesc as a function of redshift. Symbols are the same as in Fig. 6. The magenta points are the average fesc values of our sample at z = 6.5 and z = 8. The green dots are the M23 sources, while the green point is the average fesc value at z = 5.1. The blue hexagons represent the Lyα emitters from Saxena et al. (2023). The red line is the prediction at fixed M1500 = −19 from Rosdahl et al. (2022), the orange line is the prediction from Finkelstein et al. (2019) for sources with M1500 between −20 and −16.
Current usage metrics show cumulative count of Article Views (full-text article views including HTML views, PDF and ePub downloads, according to the available data) and Abstracts Views on Vision4Press platform.
Data correspond to usage on the plateform after 2015. The current usage metrics is available 48-96 hours after online publication and is updated daily on week days.
Initial download of the metrics may take a while.