Open Access
Fig. 5.
Download original image
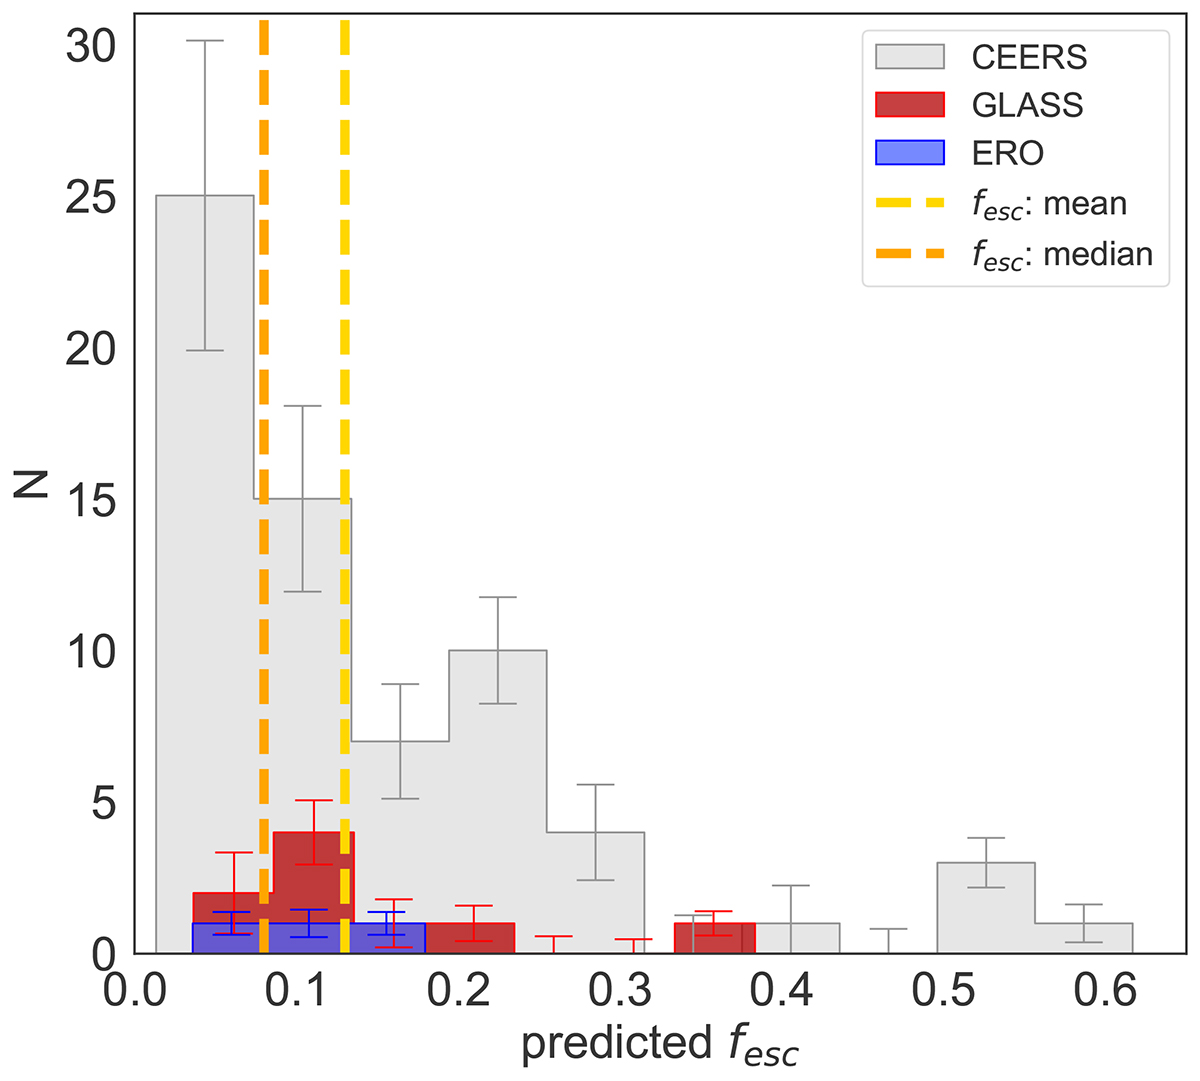
Predicted fesc distribution for the analyzed sources at 6 ≤ z ≤ 9 (gray: CEERS sample; red and blue are respectively the GLASS sample and the ERO sample). The mean fesc of the sample is shown in yellow, the median fesc is presented in orange.
Current usage metrics show cumulative count of Article Views (full-text article views including HTML views, PDF and ePub downloads, according to the available data) and Abstracts Views on Vision4Press platform.
Data correspond to usage on the plateform after 2015. The current usage metrics is available 48-96 hours after online publication and is updated daily on week days.
Initial download of the metrics may take a while.