Fig. 4.
Download original image
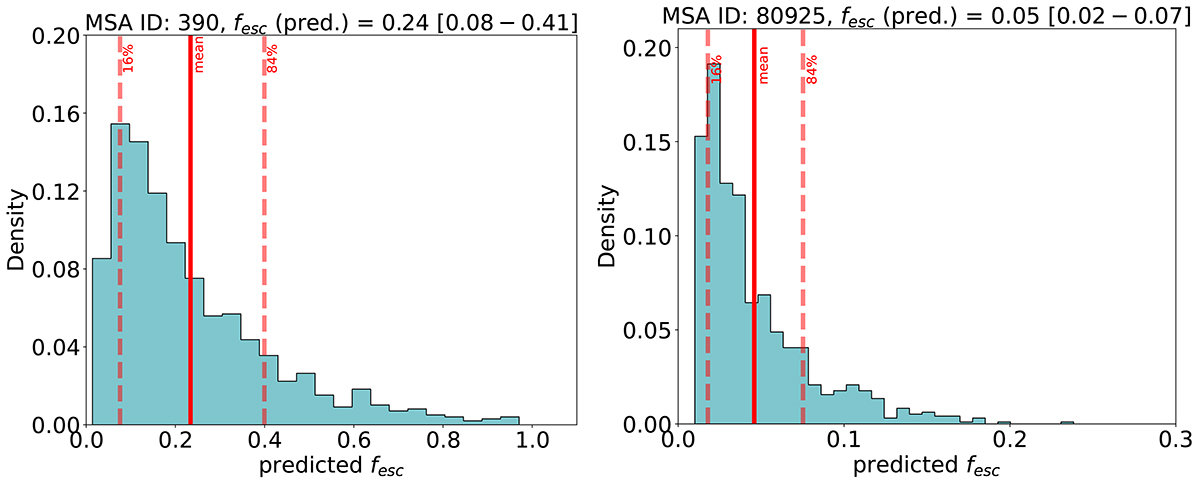
PDFs of the fesc values for two sources from the CEERS sample (MSA IDs: 390 and 80925). The considered fesc of the source, which is the mean fesc of the distribution, is shown in red. Given the non-normal distribution of the fesc values, we have included the 16th and 84th percentiles (red dashed lines) to measure the confidence interval.
Current usage metrics show cumulative count of Article Views (full-text article views including HTML views, PDF and ePub downloads, according to the available data) and Abstracts Views on Vision4Press platform.
Data correspond to usage on the plateform after 2015. The current usage metrics is available 48-96 hours after online publication and is updated daily on week days.
Initial download of the metrics may take a while.