Fig. 3.
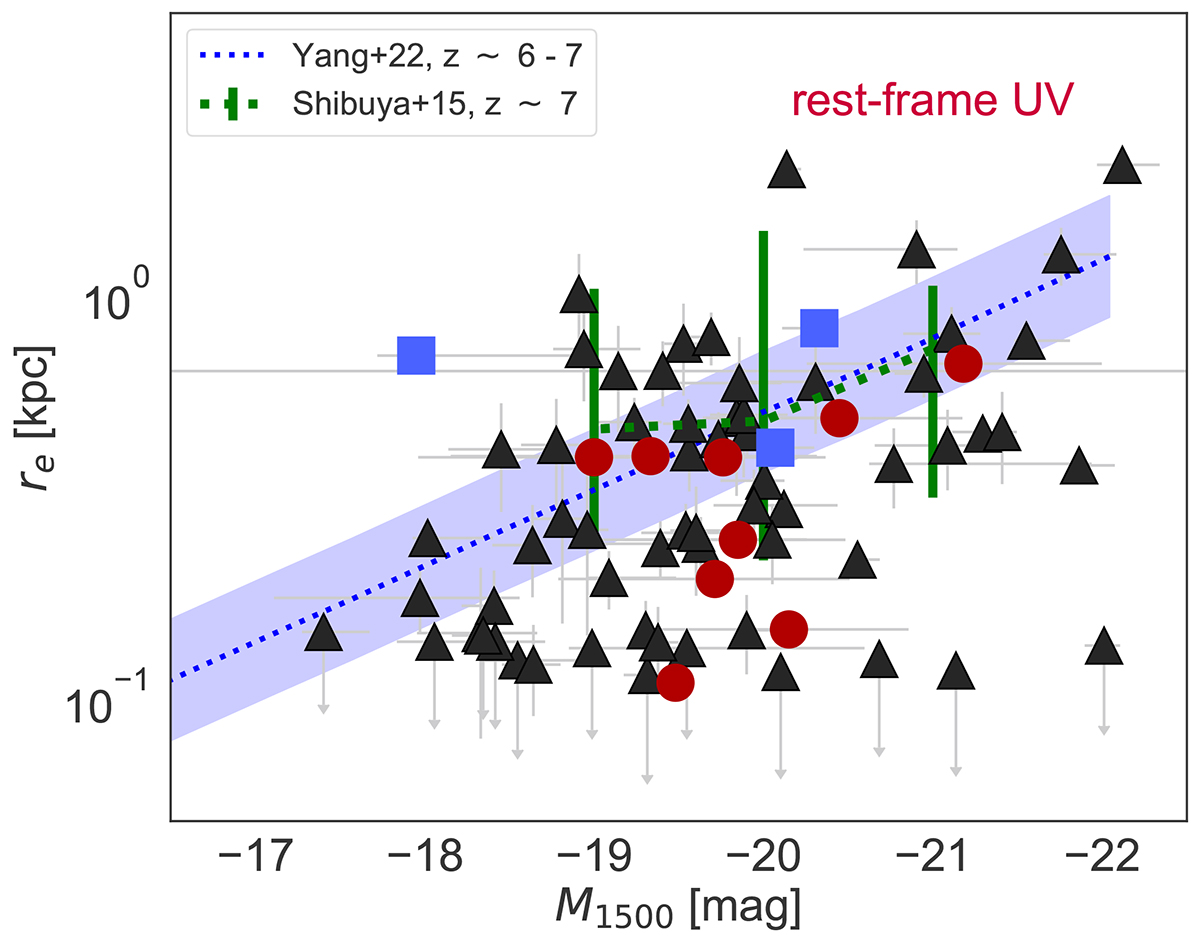
Download original image
Rest-frame UV re vs. M1500. Symbols are the same as in Fig. 2. The green line shows the relation derived from HST data by Shibuya et al. (2015) at z ∼ 7, the blue line shows the size-luminosity relation at z ∼ 6 − 7 from Yang et al. (2022b). The Spearman rank correlation coefficient for the correlation between re and M1500 is −0.33, with a p-value of 0.003.
Current usage metrics show cumulative count of Article Views (full-text article views including HTML views, PDF and ePub downloads, according to the available data) and Abstracts Views on Vision4Press platform.
Data correspond to usage on the plateform after 2015. The current usage metrics is available 48-96 hours after online publication and is updated daily on week days.
Initial download of the metrics may take a while.