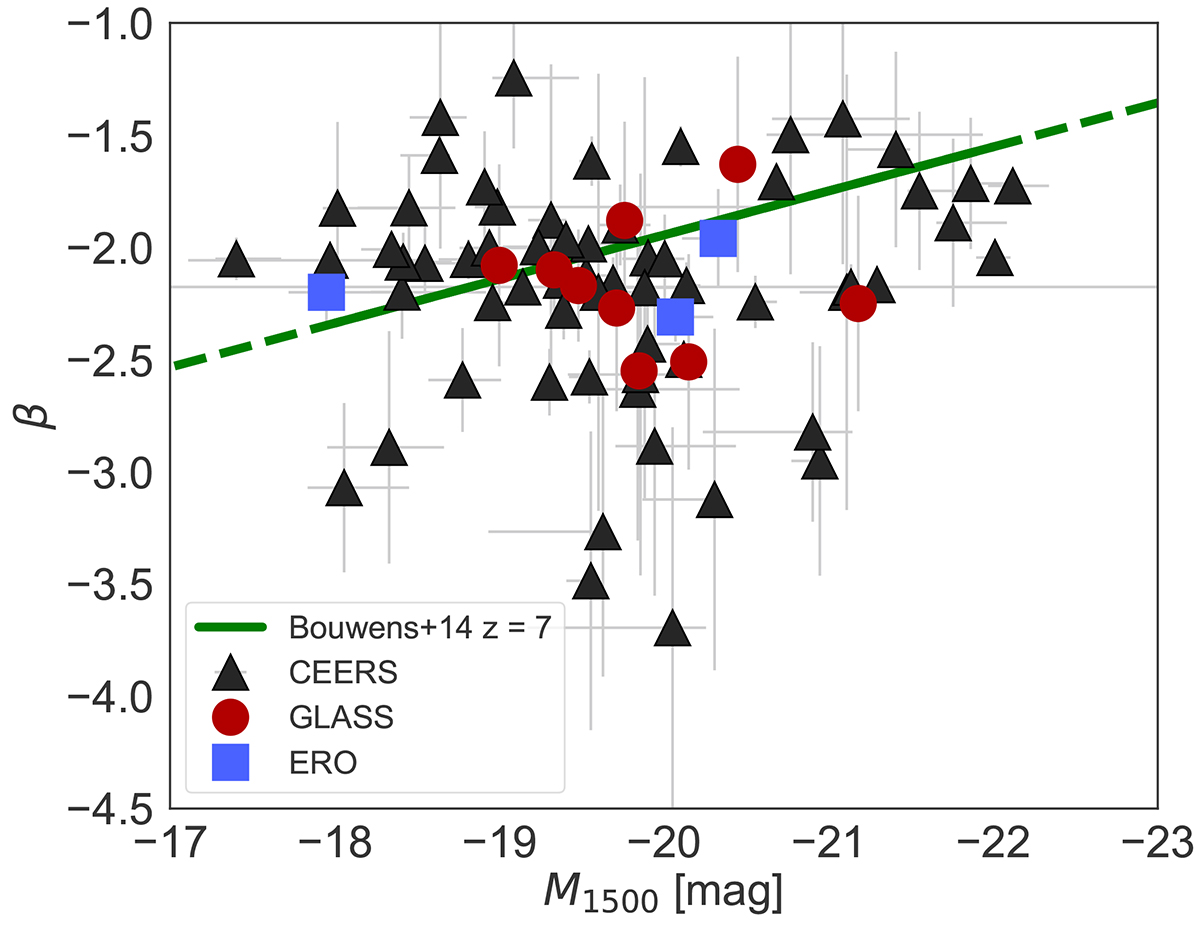
Fig. 2.
Download original image
β vs. M1500. Black triangles represent the CEERS sources with β slope obtained fitting 3 or 2 photometric bands. Red dots are for the GLASS sample, and blue squares are for the ERO sample. The green line shows the relation at z ∼ 7 derived from HST data by Bouwens et al. (2014). Dashed portions indicate the extrapolation of the relation in our range of M1500. The Spearman rank correlation coefficient for the correlation between β and M1500 is 0.36, with a p-value of 0.02.
Current usage metrics show cumulative count of Article Views (full-text article views including HTML views, PDF and ePub downloads, according to the available data) and Abstracts Views on Vision4Press platform.
Data correspond to usage on the plateform after 2015. The current usage metrics is available 48-96 hours after online publication and is updated daily on week days.
Initial download of the metrics may take a while.