Fig. 10.
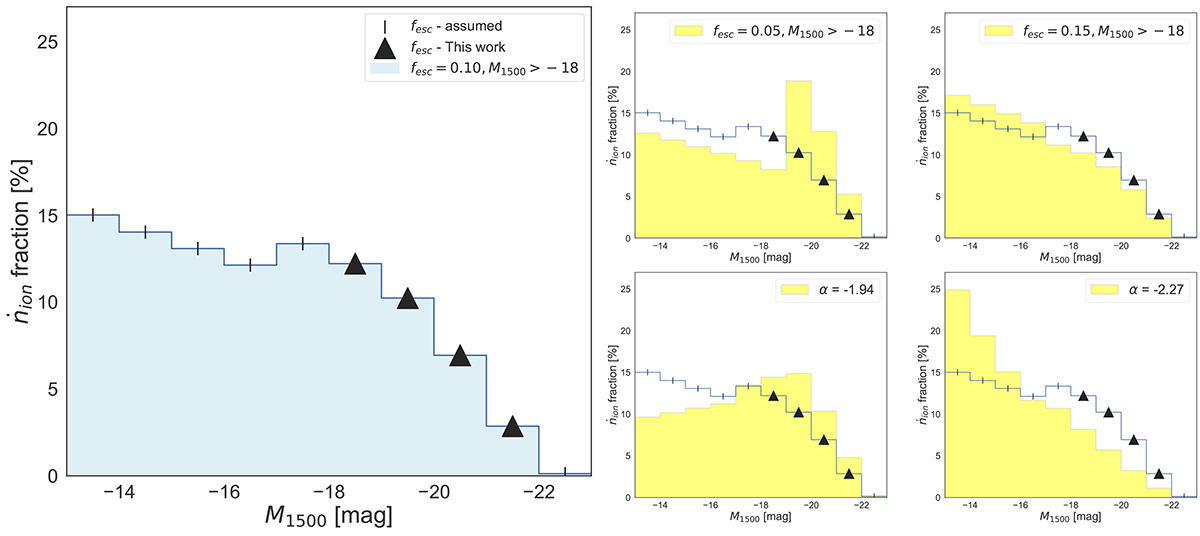
Download original image
Left: the ṅion fraction of galaxies at 6 ≤ z ≤ 9 as function of the M1500. Triangles represent the ṅion obtained from the predicted fesc as a function of M1500 in each bin. Bars represent the extrapolated value, i.e. the ṅion fraction derived assuming that for M1500 > −18 a fesc value constant and equal to 0.10, and for M1500 < −22 a fesc value constant and equal to 0.05. Right: in yellow we show the ṅion fraction of galaxies at 6 ≤ z ≤ 9 as function of M1500 changing, respectively, from the top left to the bottom right, the fesc values at the faint-end (0.05 and 0.15) and the α parameter of the ρUV (−1.94 and −2.27). The original result is also shown with the same symbols as in the figure from the left.
Current usage metrics show cumulative count of Article Views (full-text article views including HTML views, PDF and ePub downloads, according to the available data) and Abstracts Views on Vision4Press platform.
Data correspond to usage on the plateform after 2015. The current usage metrics is available 48-96 hours after online publication and is updated daily on week days.
Initial download of the metrics may take a while.