Fig. 4
Download original image
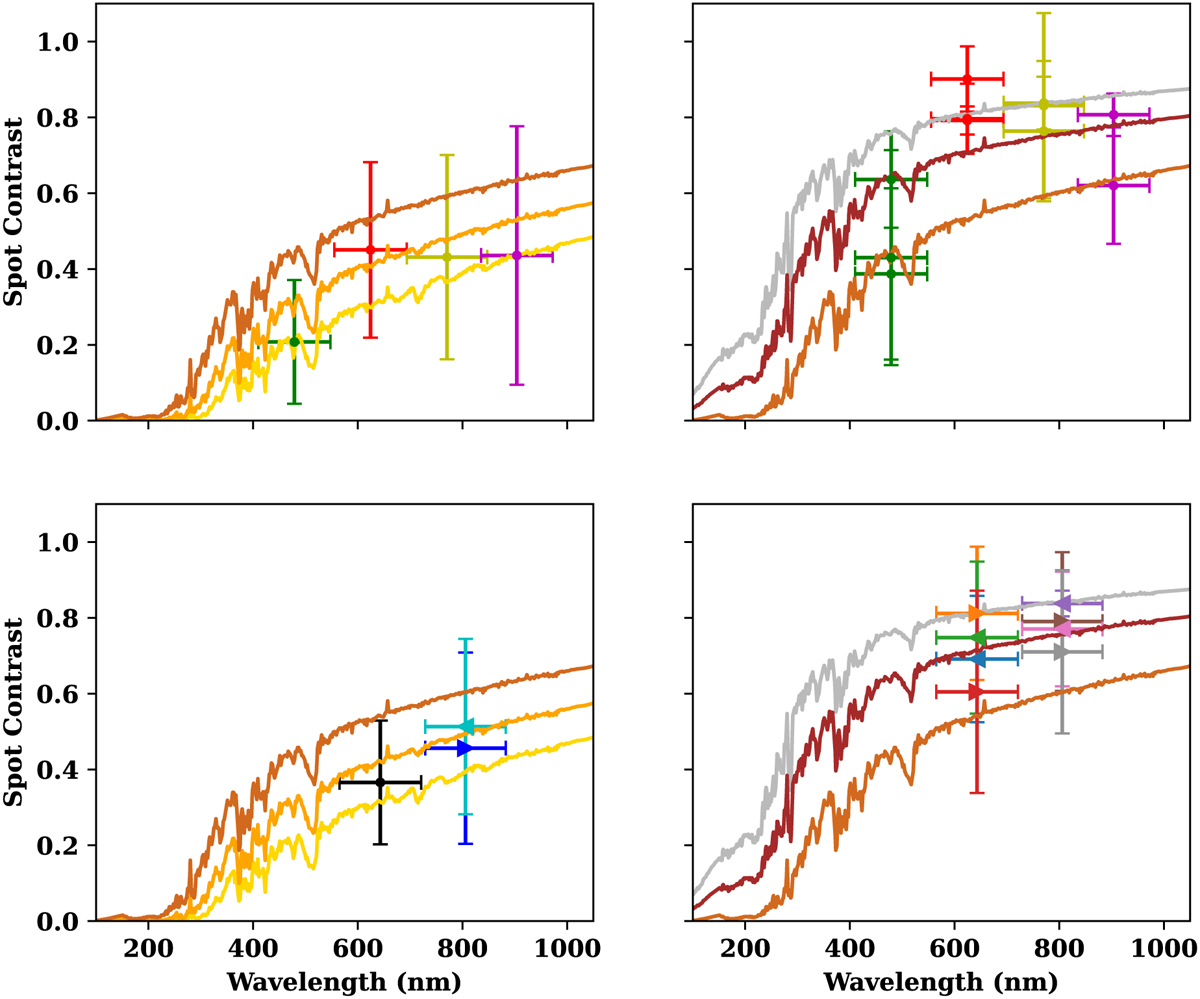
Variation in the starspot contrast with wavelength. The vertical bars represent the errors in the measurements and the horizontal bars show the FWHM transmission of the passbands used. In the upper panels, the colour of the data points is in agreement with Fig. 2. In the top left panel, the data taken on 2012 February 28 with the GROND multi-band camera are represented together with the ATLAS9 (Kurucz 1979) stellar atmospherical models computed considering a stellar surface at 5227 K and a starspot at 4200 and 4400 K. In the top right panel, the data taken on 2012 June 1st with the GROND multi-band camera are represented together with the ATLAS9 stellar atmospherical models computed considering a stellar surface at 5227 K and a starspot at 4600, 4850, and 4980 K. In the bottom panels, the points represent the contrast values obtained using the Danish 1.54 m transits (as explained in the plot legend), while the curves are the same ATLAS9 models used in the upper panels.
Current usage metrics show cumulative count of Article Views (full-text article views including HTML views, PDF and ePub downloads, according to the available data) and Abstracts Views on Vision4Press platform.
Data correspond to usage on the plateform after 2015. The current usage metrics is available 48-96 hours after online publication and is updated daily on week days.
Initial download of the metrics may take a while.