Fig. 2
Download original image
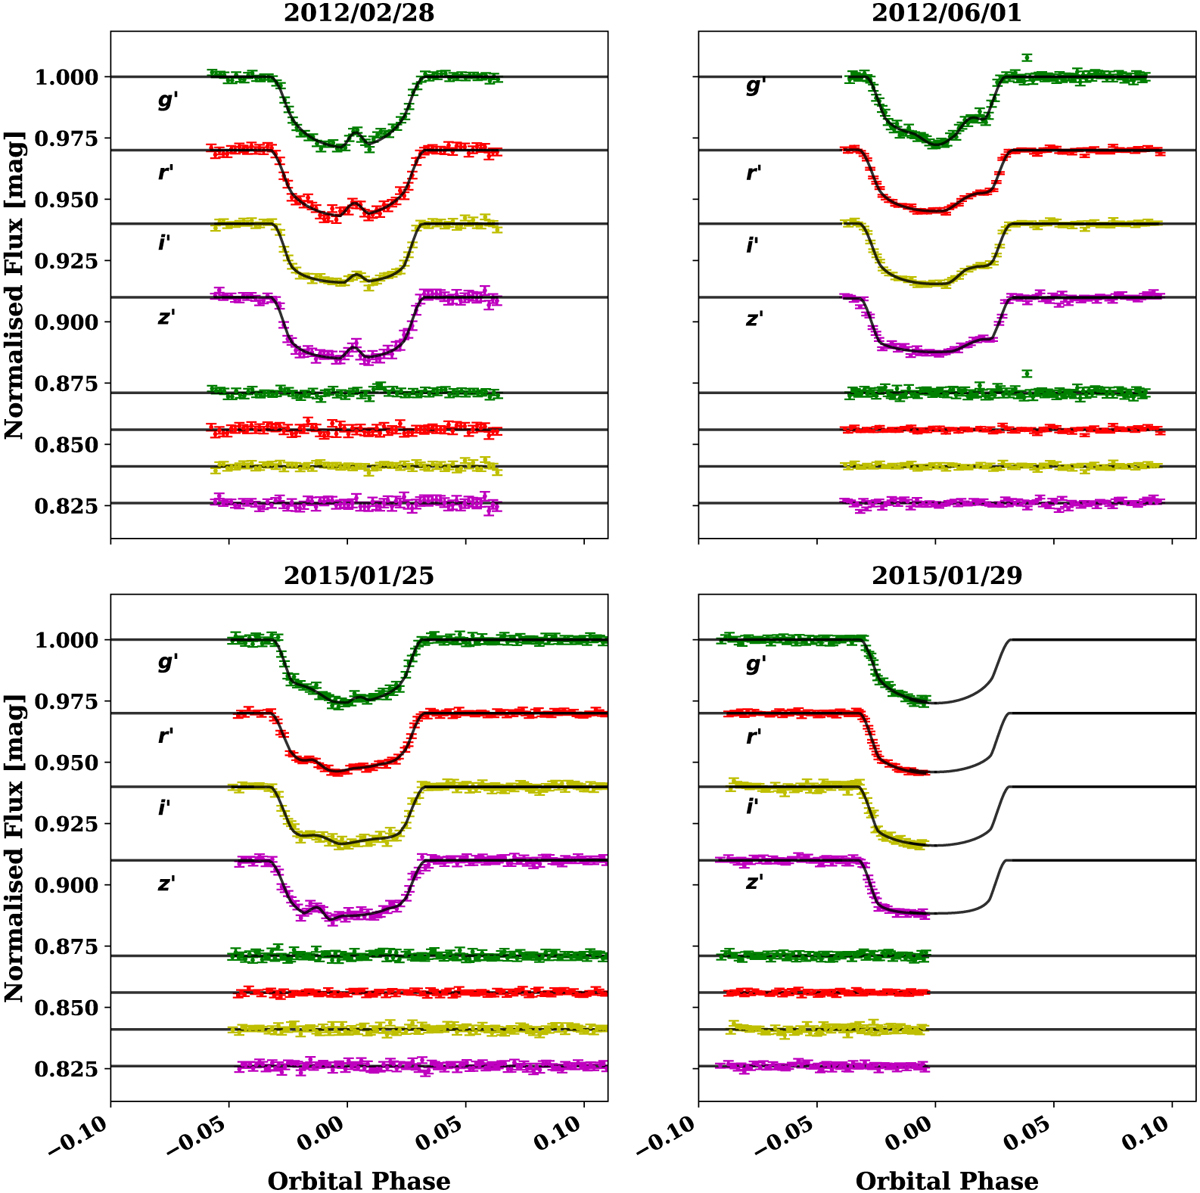
Light curves of four (three complete and one partial) transits of HATS-2 b simultaneously observed in four optical bands (Sloan g′, r′, i′, z′) with the GROND multi-band camera at the MPG 2.2 m telescope. They are shown in date order. The light curves in the top panels are from Mohler-Fischer et al. (2013), while those in the bottom panels are from this work. Starspot anomalies are visible in the first three data sets. The light curves are plotted against the orbital phase and are compared to the best-fitting models. The residuals of the fits are shown at the base of each panel.
Current usage metrics show cumulative count of Article Views (full-text article views including HTML views, PDF and ePub downloads, according to the available data) and Abstracts Views on Vision4Press platform.
Data correspond to usage on the plateform after 2015. The current usage metrics is available 48-96 hours after online publication and is updated daily on week days.
Initial download of the metrics may take a while.