Fig. 5.
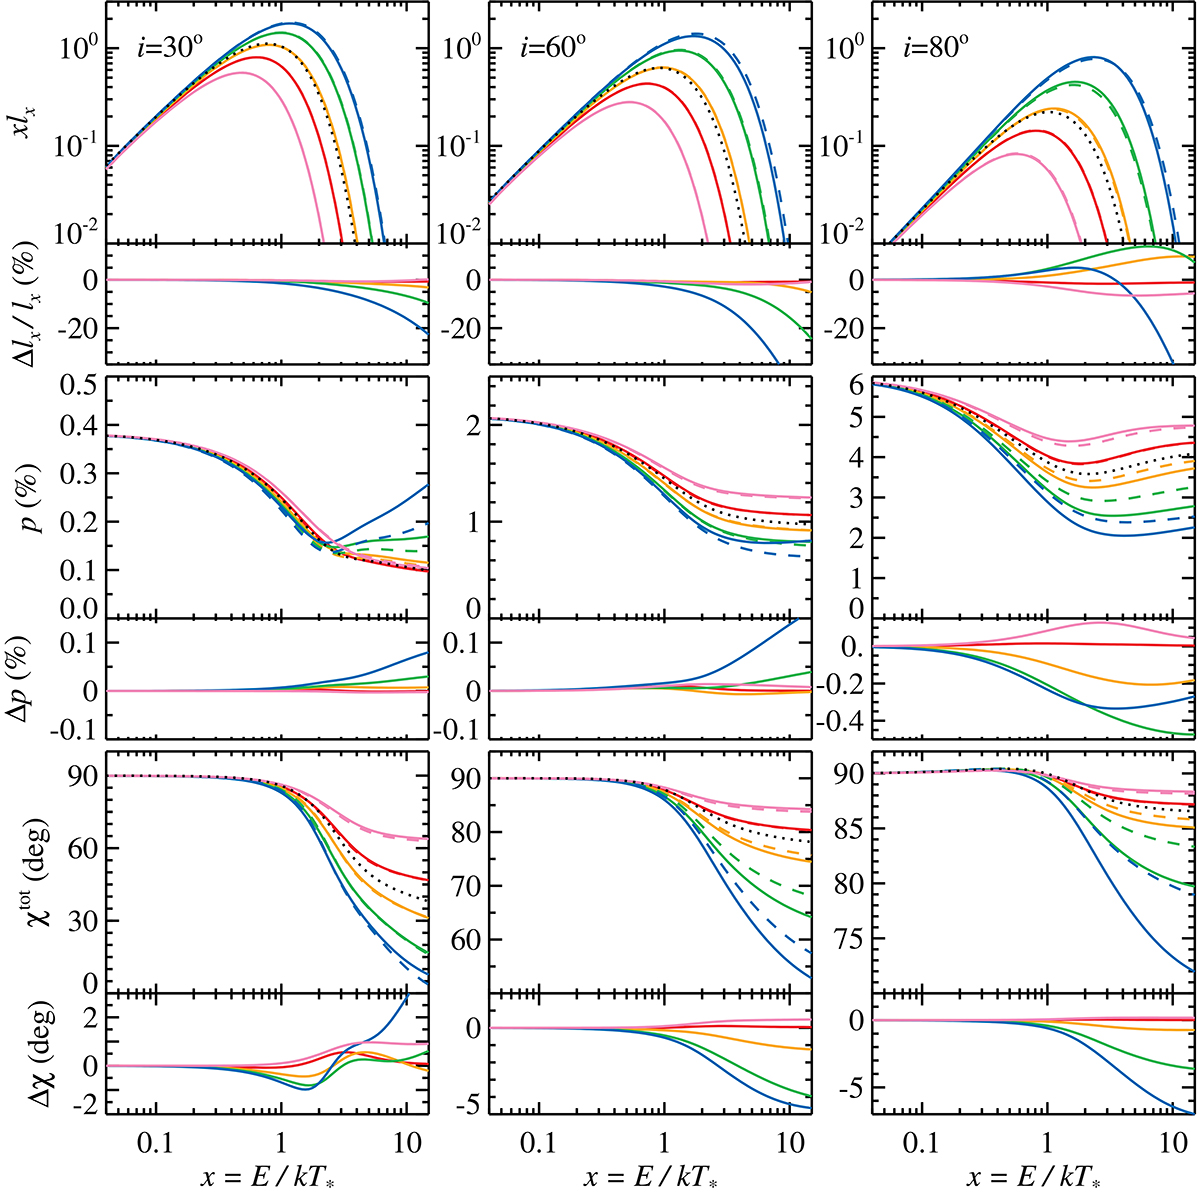
Download original image
Spectra of the luminosity xlx (upper panels), PD (middle panels) and PA (bottom panels) for different inclinations i = 30° (left), 60° (middle), and 80° (right column) and BH spin a = −1 (pink lines), 0 (red), 0.5 (orange), 0.8 (green), and 0.94 (blue). The solid lines correspond to the results obtained with the approximate analytical formulae (ARTPOL), while the dashed lines correspond to the exact numerical integration of the geodesics (ARCMANCER). The accretion disk extends from rISCO to rout = 3000 for each case. Narrow panels show the difference between the results given by the two methods. The black dotted lines denote the results for a Newtonian disk from Loktev et al. (2022).
Current usage metrics show cumulative count of Article Views (full-text article views including HTML views, PDF and ePub downloads, according to the available data) and Abstracts Views on Vision4Press platform.
Data correspond to usage on the plateform after 2015. The current usage metrics is available 48-96 hours after online publication and is updated daily on week days.
Initial download of the metrics may take a while.