Fig. 4.
Download original image
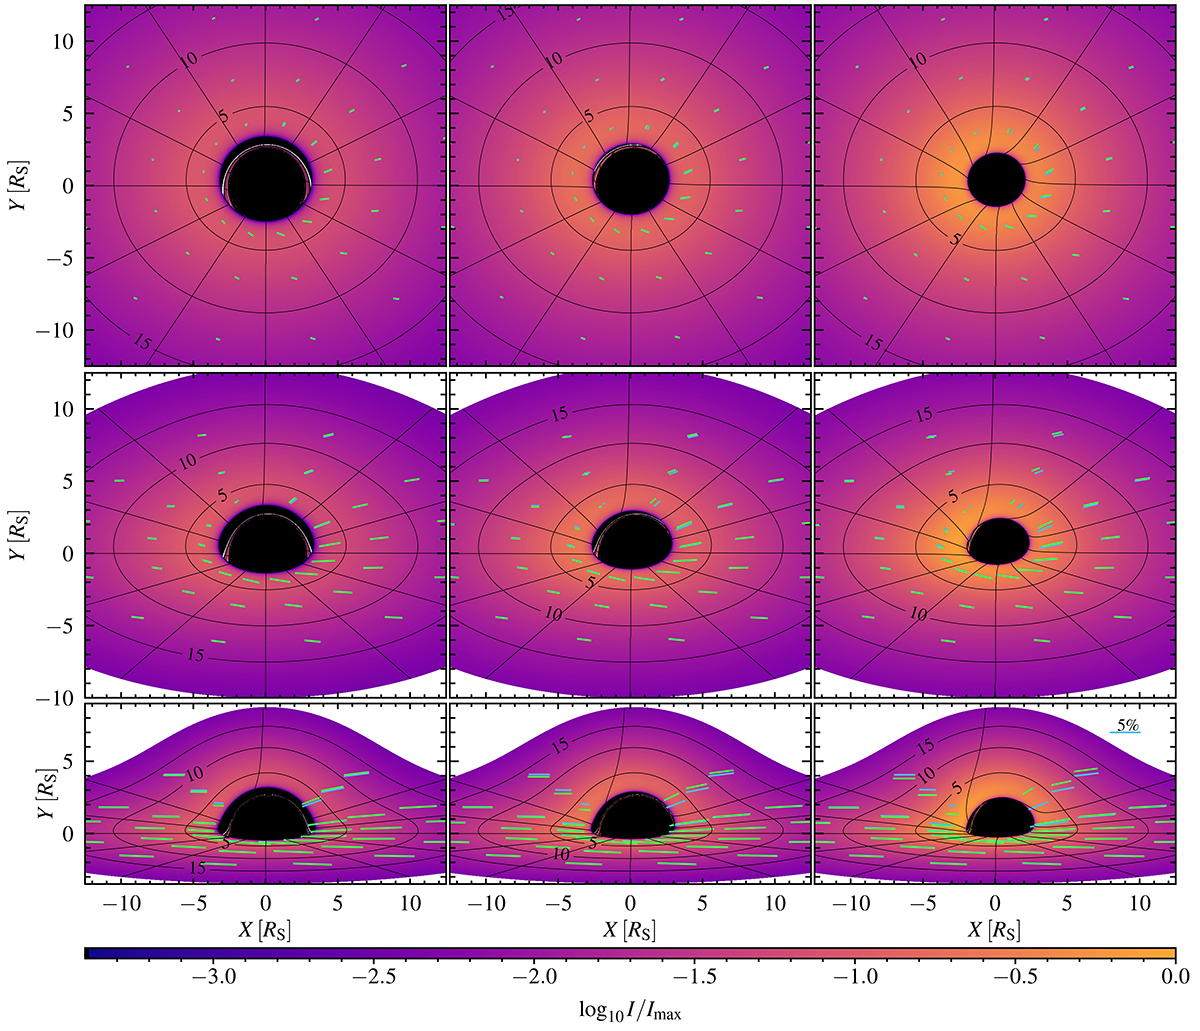
Polarization parameters of radiation from the disk at inclinations i = 30° (upper row), 60° (middle row), and 80° (lower row), and different spin parameters a = 0.2 (left column), 0.5 (middle column), and 0.8 (right column). The black lines outline an even polar grid on the disk with rays spaced by 30° in azimuth and contours spaced by 5RS in radius (the corresponding values are denoted in each ring). The sticks represent the polarization parameters derived for the center of each grid segment. The polarized disk emission were calculated using the exact numerical interaction of the geodesics in the Kerr metric (with the ARCMANCER code; green lines) and using the approximate analytical formulae in the Schwarzschild metric (with the ARTPOL code; cyan lines). The coordinates of the cyan sticks were computed using Eq. (50). The length of the sticks is proportional to the observed PD from the region and the orientation shows the observed PA. The 5% polarization stick is shown in the bottom right panel to scale. The colors reflect the logarithm of the bolometric intensity relative to the maximal value across all panels. We note that differences between the exact numerical solution and the approximate ARTPOL method are visible only at the inner radii for systems with the highest spin values.
Current usage metrics show cumulative count of Article Views (full-text article views including HTML views, PDF and ePub downloads, according to the available data) and Abstracts Views on Vision4Press platform.
Data correspond to usage on the plateform after 2015. The current usage metrics is available 48-96 hours after online publication and is updated daily on week days.
Initial download of the metrics may take a while.