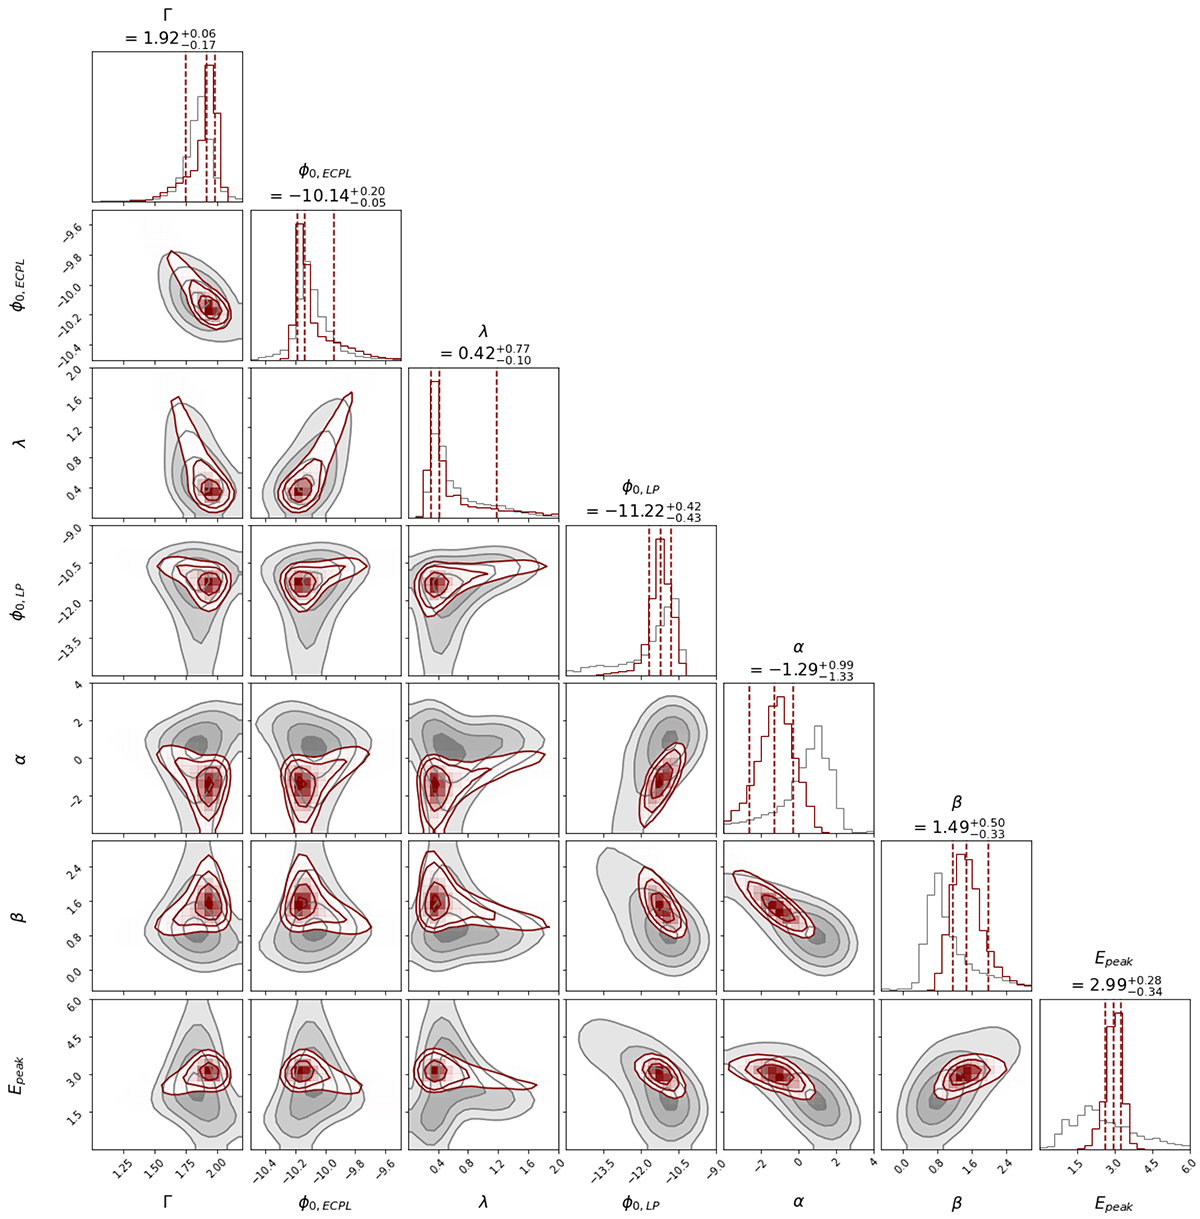
Fig. 7.
Download original image
Corner plot of the parameters obtained from the fitted models to the simulated CTA spectrum. Maroon-colored contours and distributions are based on simulations with the SSC+π0 model fitted with the dual-component (ECPL+LP) model. The gray samples correspond to simulations based on the featureless ECPL model (i.e., no “bump”) that are also fitted with the dual-component model. Contour lines indicate the 11.8%, 39.3%, 67.5%, and 86.4% levels. The parameter Epeak denotes the peak energy of the LP component (in TeV). This is not a free model parameter, but was obtained from α and β – see Eq. (8).
Current usage metrics show cumulative count of Article Views (full-text article views including HTML views, PDF and ePub downloads, according to the available data) and Abstracts Views on Vision4Press platform.
Data correspond to usage on the plateform after 2015. The current usage metrics is available 48-96 hours after online publication and is updated daily on week days.
Initial download of the metrics may take a while.