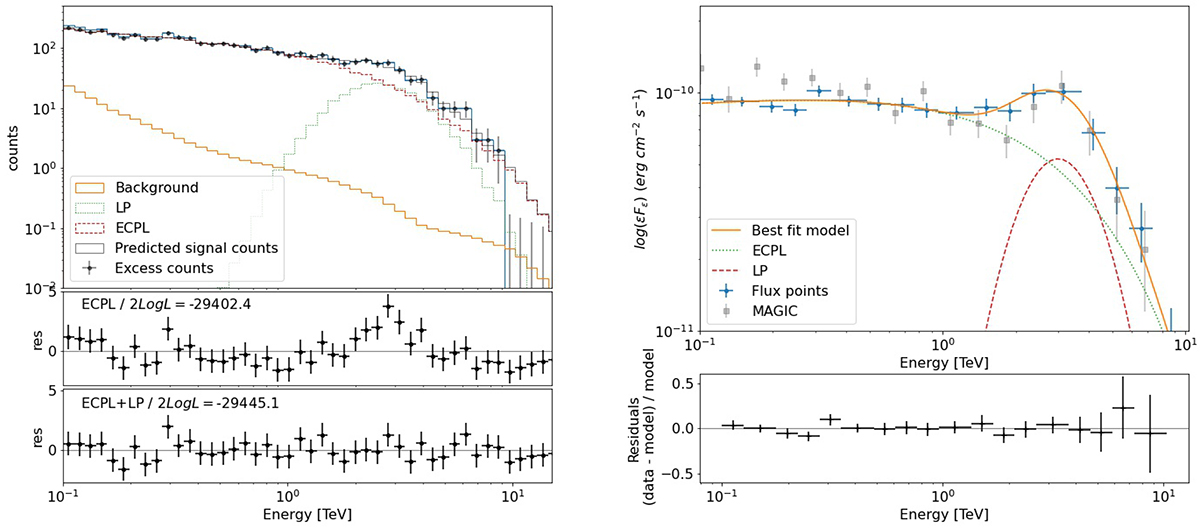
Fig. 5.
Download original image
Left panel: simulated γ-ray spectrum of Mrk 501 for CTA based on the SSC+π0 model shown in Fig. 4 and a 30-min exposure. For illustrative purposes, the decomposition of the best-fit dual-component (ECPL+LP) model is also shown (colored histograms). The middle and bottom panels show the residuals of the fit, defined as (model-data)/error, for the ECPL and ECLP+LP models, respectively. Right panel: unfolded binned γ-ray spectrum (blue markers) and best-fit dual-component model (solid orange line), with the residuals shown in the bottom panel. The ECPL and LP components of the best-fit spectrum are also plotted for clarity. For comparison, the observed MAGIC spectrum (obtained with a ∼1.5 h exposure) is overplotted (gray squares).
Current usage metrics show cumulative count of Article Views (full-text article views including HTML views, PDF and ePub downloads, according to the available data) and Abstracts Views on Vision4Press platform.
Data correspond to usage on the plateform after 2015. The current usage metrics is available 48-96 hours after online publication and is updated daily on week days.
Initial download of the metrics may take a while.