Fig. 4.
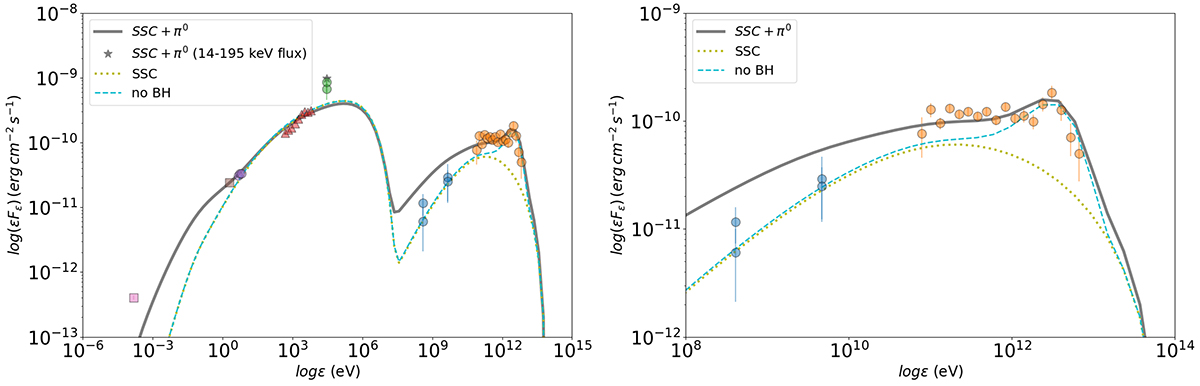
Download original image
Left panel: broadband SED of Mrk 501 on MJD 56857.98 compiled using data from MAGIC (orange circles, corrected for EBL attenuation), Fermi-LAT (averaged over four and ten days, blue circles), Swift-XRT (red triangles), Swift-BAT (integrated flux in 14–195 keV from one-day observations, shown with green circles), Swift-UVOT (purple circles), KVA (purple square), and Metsähovi (pink square). The SSC+π0 model SED is overplotted (solid line). For comparison, we also show the SED when Bethe-Heitler pair production is neglected (dashed line), and the purely leptonic (SSC) model (dotted line). Right panel: zoom-in of the γ-ray spectrum.
Current usage metrics show cumulative count of Article Views (full-text article views including HTML views, PDF and ePub downloads, according to the available data) and Abstracts Views on Vision4Press platform.
Data correspond to usage on the plateform after 2015. The current usage metrics is available 48-96 hours after online publication and is updated daily on week days.
Initial download of the metrics may take a while.