Fig. 1.
Download original image
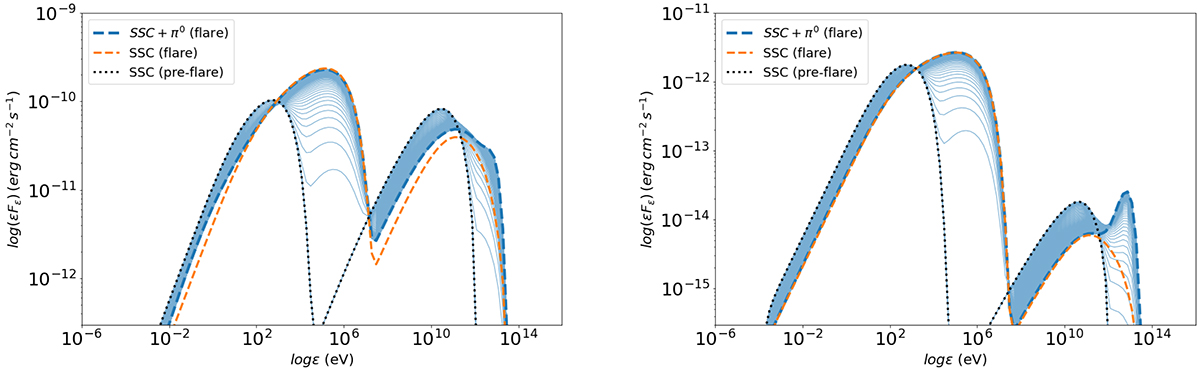
SED snapshots (solid lines) showing the evolution from a pre-flare steady state (dotted black line) to a new steady state that corresponds to the peak of a hard X-ray flare when protons are injected with ![]() = 103.5 (dashed blue line). For comparison, the pure SSC flare spectrum is overplotted (dotted orange line). The time interval between successive snapshots is
= 103.5 (dashed blue line). For comparison, the pure SSC flare spectrum is overplotted (dotted orange line). The time interval between successive snapshots is ![]() and the total duration in the observer’s frame is
and the total duration in the observer’s frame is ![]() h. The left and right panels show the results for ℓe = 10−4, ℓp = 1 and ℓe = 10−6, ℓp = 10−1, respectively. Other parameters used are B′ = 0.86 G, R′ = 1015 cm, se = sp = 1.7,
h. The left and right panels show the results for ℓe = 10−4, ℓp = 1 and ℓe = 10−6, ℓp = 10−1, respectively. Other parameters used are B′ = 0.86 G, R′ = 1015 cm, se = sp = 1.7, ![]() = 105 (pre-flare) and 106.5 (flare),
= 105 (pre-flare) and 106.5 (flare), ![]() , and δ = 20. The attenuation of VHE γ-rays due to the extragalactic background light is not included here.
, and δ = 20. The attenuation of VHE γ-rays due to the extragalactic background light is not included here.
Current usage metrics show cumulative count of Article Views (full-text article views including HTML views, PDF and ePub downloads, according to the available data) and Abstracts Views on Vision4Press platform.
Data correspond to usage on the plateform after 2015. The current usage metrics is available 48-96 hours after online publication and is updated daily on week days.
Initial download of the metrics may take a while.