Fig. 1
Download original image
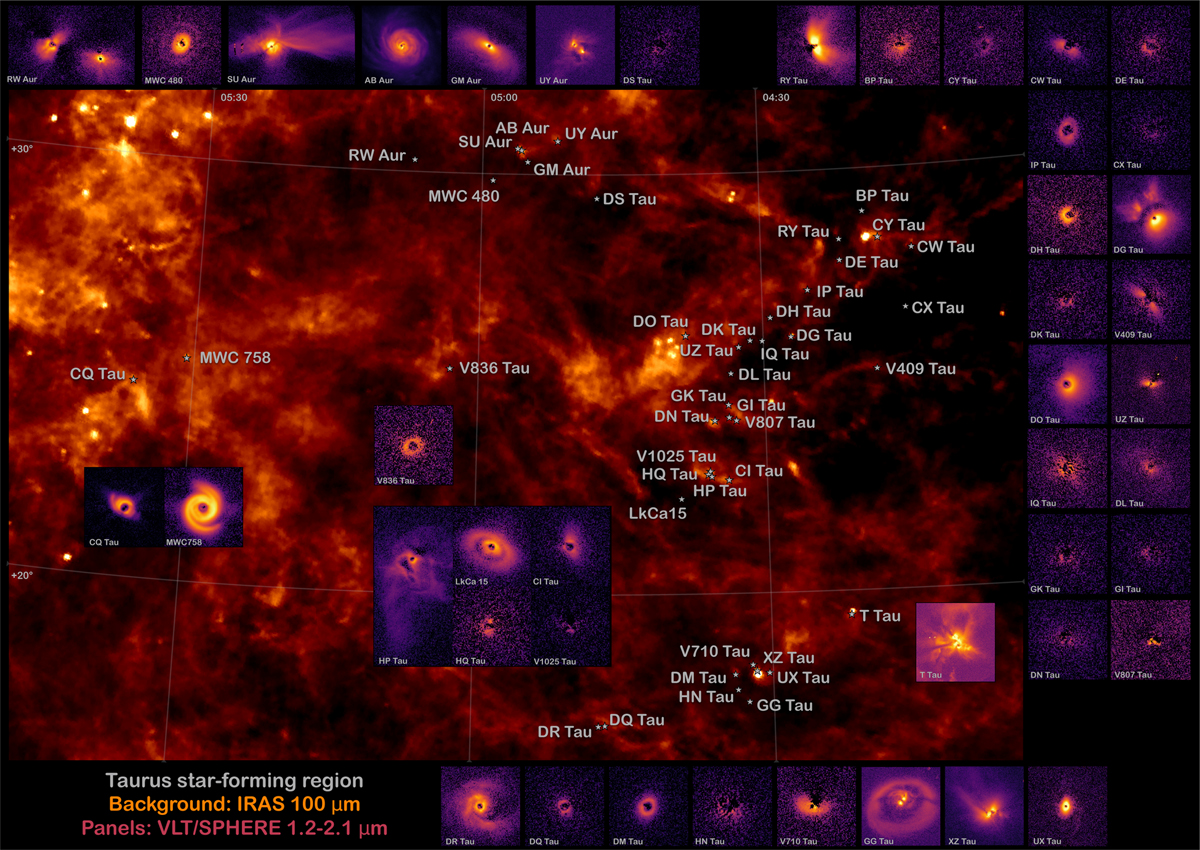
Spatial distribution of sample. The background image is the Taurus region at 100 µm (Band 4) from the Improved Reprocessing of the IRAS Survey (IRIS). The SPHERE images in the J, H, or K bands (see Table B.2) are shown in the inset panels with spatial and flux scales optimized for better representation (whereas the actual scales can be seen in Fig. 2).
Current usage metrics show cumulative count of Article Views (full-text article views including HTML views, PDF and ePub downloads, according to the available data) and Abstracts Views on Vision4Press platform.
Data correspond to usage on the plateform after 2015. The current usage metrics is available 48-96 hours after online publication and is updated daily on week days.
Initial download of the metrics may take a while.