Fig. 9.
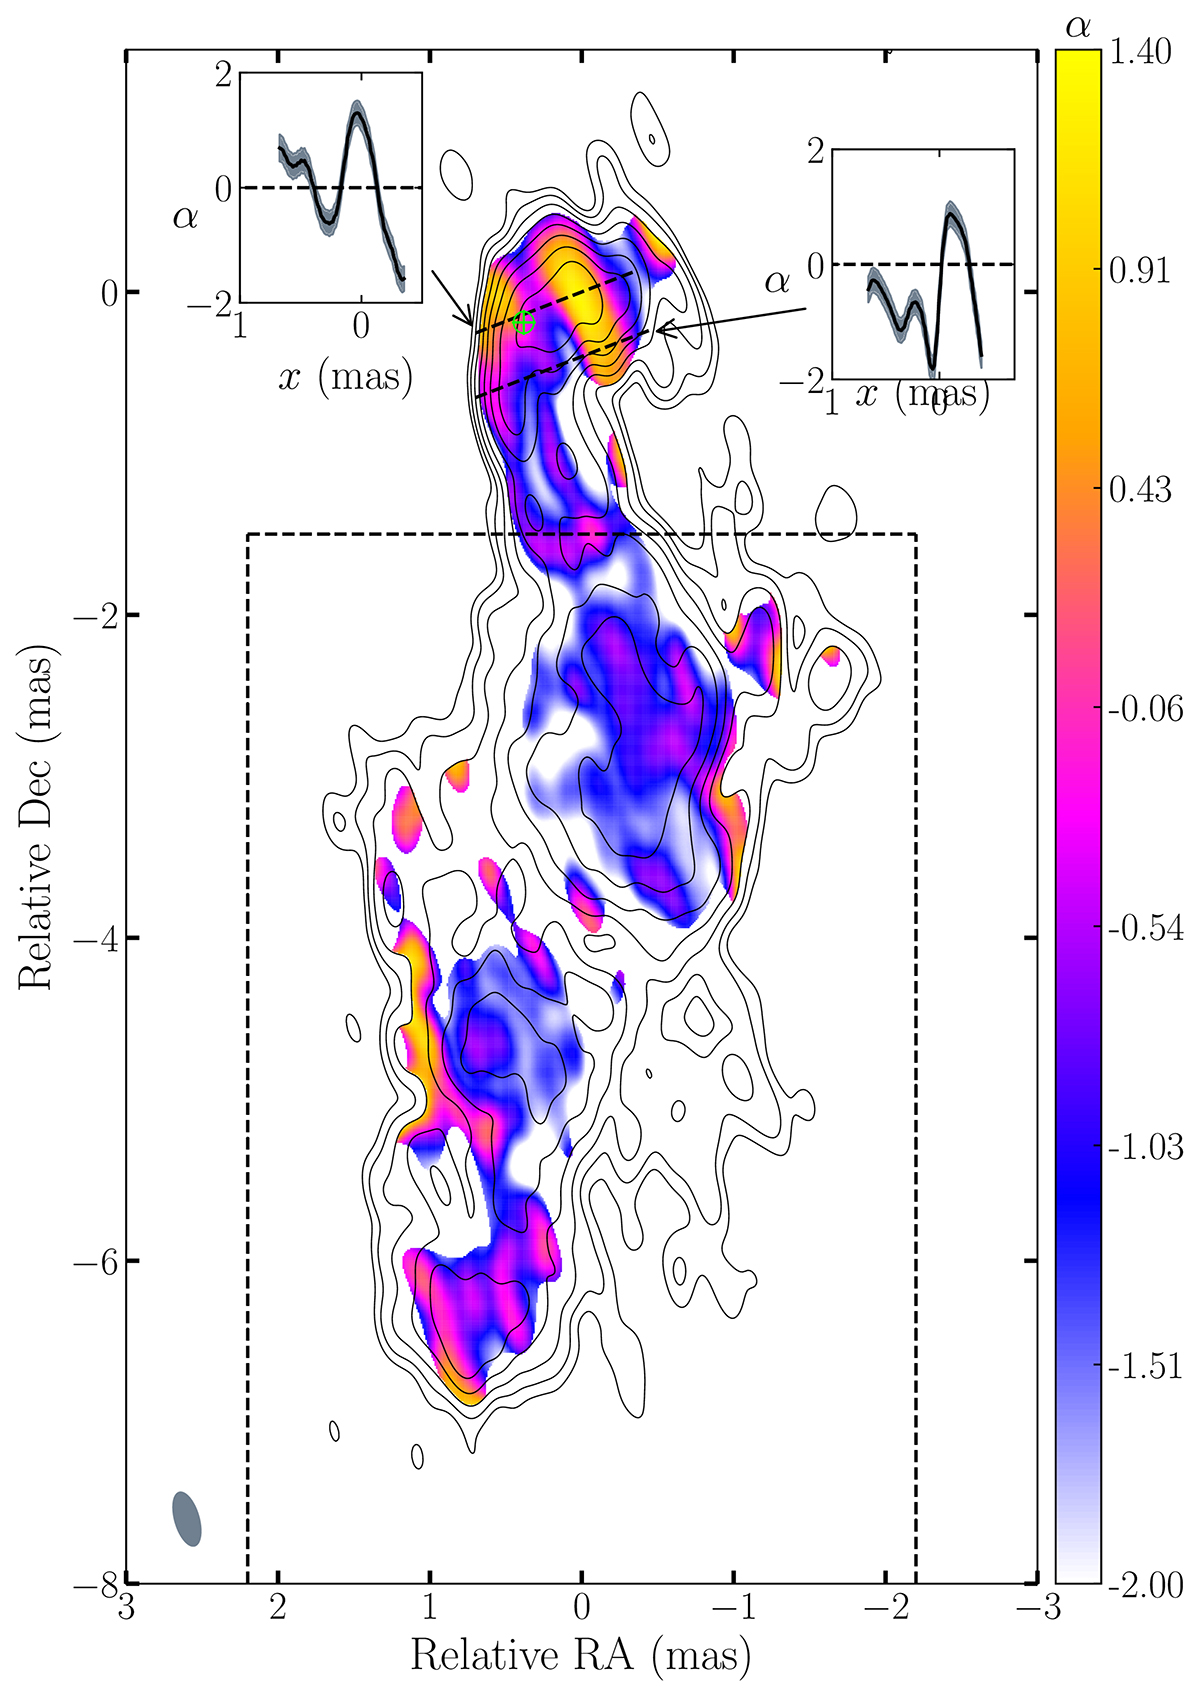
Download original image
Similar to Fig. 6, but displaying the complete parsec-scale jet region. The modelfit component, located near the inverted spectrum region close to the jet deflection point and used to discuss the possibility of SSA for the observed inverted spectrum, is represented by the encircled lime-colored cross in the figure. The optically thin jet region utilized for cross-correlation calculations in Sect. 3.2 is demarcated by a black dashed box.
Current usage metrics show cumulative count of Article Views (full-text article views including HTML views, PDF and ePub downloads, according to the available data) and Abstracts Views on Vision4Press platform.
Data correspond to usage on the plateform after 2015. The current usage metrics is available 48-96 hours after online publication and is updated daily on week days.
Initial download of the metrics may take a while.