Fig. 6.

Download original image
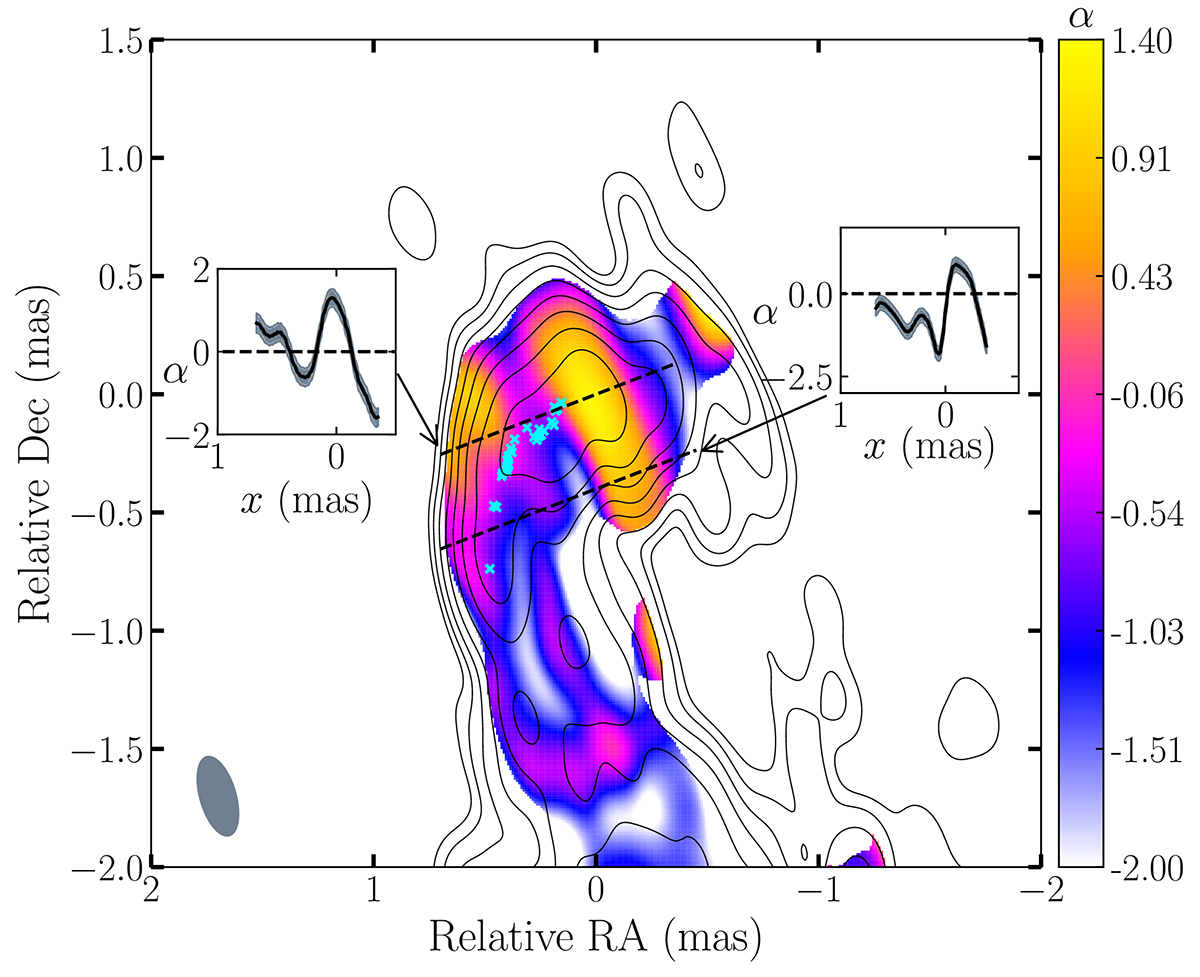
Spectral index map of the 3C 84 jet. Color represents the spectral index distribution of 3C 84 derived from the images obtained with the GVA at 22 GHz on November 9, 2022, and the VLBA at 43 GHz on November 1, 2022, overlaid on the total intensity contours at 22 GHz. Contours initiate at a level of five times the off-source image rms noise and increment by a factor of two. Prior to computing the spectral index, the images were aligned to maximize the cross-correlation coefficient of the optically thin jet emission. The inset figures depict the spectral indices along the slices indicated by the black dashed lines. The cyan crosses indicate the positions of the knot identified through the WISE analysis. The jet edge near the deflection point of the knot exhibits an inverted spectrum, with a maximum spectral index of αinv ∼ 0.95. This inverted spectrum is likely attributed to the presence of a dense cold ambient medium, which is believed to contribute to the observed deflection of the knot. A corresponding plot illustrating the entire parsec-scale jet region can be seen in Fig. 9.
Current usage metrics show cumulative count of Article Views (full-text article views including HTML views, PDF and ePub downloads, according to the available data) and Abstracts Views on Vision4Press platform.
Data correspond to usage on the plateform after 2015. The current usage metrics is available 48-96 hours after online publication and is updated daily on week days.
Initial download of the metrics may take a while.


