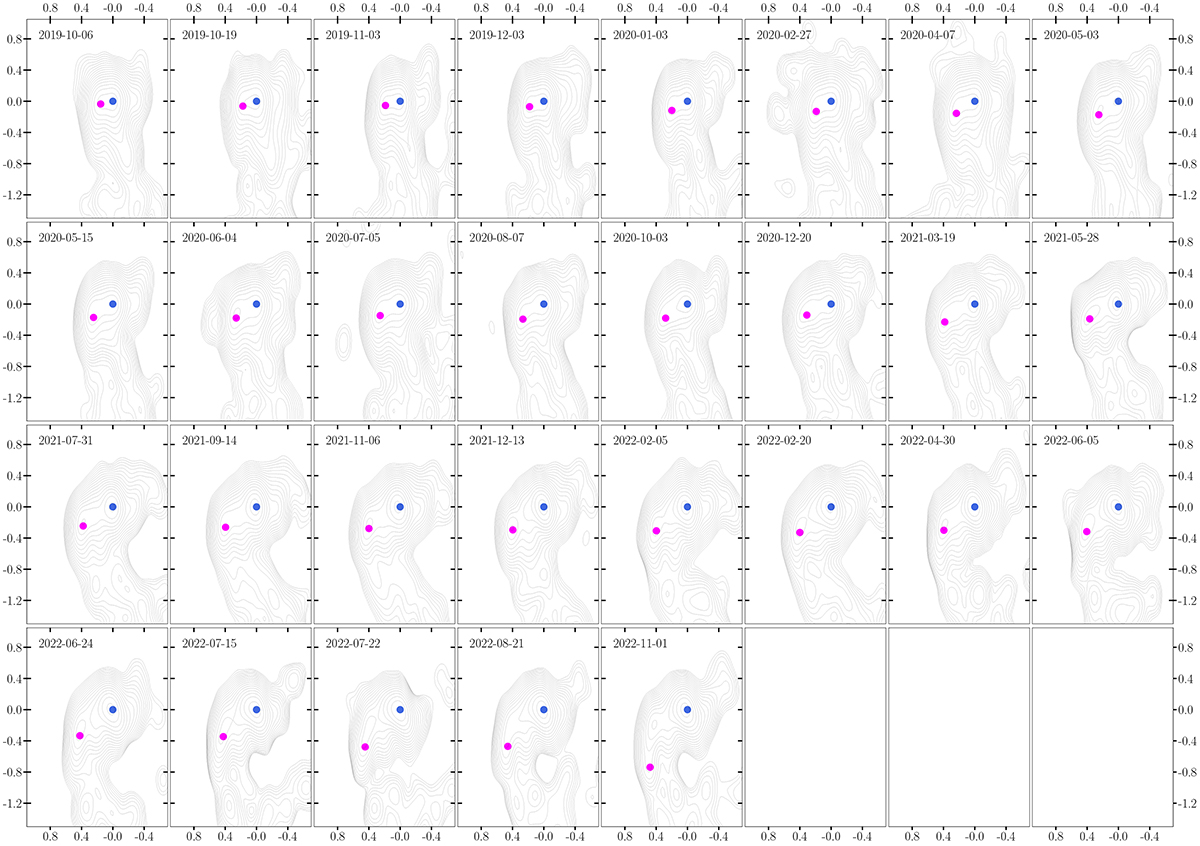
Fig. 5.
Download original image
Contour maps depicting the core region of 3C 84 based on the 43 GHz VLBA monitoring data. The positions of the assumed core, located at the map origin in each epoch, are indicated by blue filled circles. Additionally, the positions of the knots identified through the WISE analysis are marked by magenta filled circles. The observation date for each epoch is indicated in the top left corner of the respective image.
Current usage metrics show cumulative count of Article Views (full-text article views including HTML views, PDF and ePub downloads, according to the available data) and Abstracts Views on Vision4Press platform.
Data correspond to usage on the plateform after 2015. The current usage metrics is available 48-96 hours after online publication and is updated daily on week days.
Initial download of the metrics may take a while.