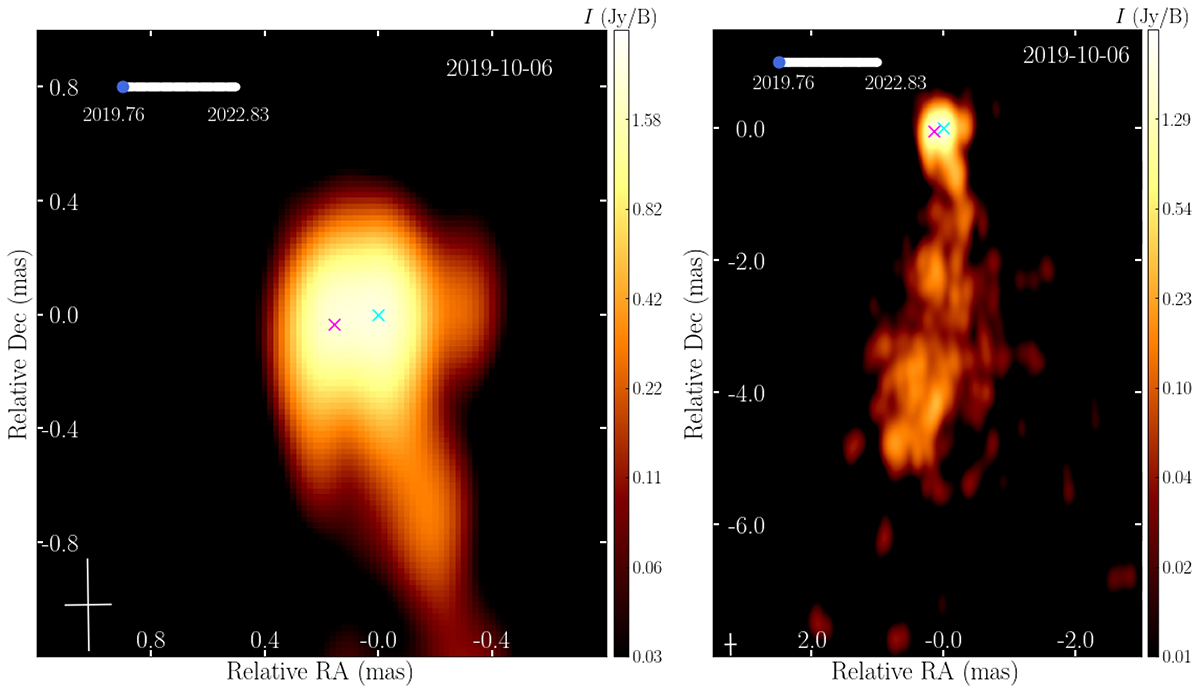
Fig. 4.
Download original image
Single frame from the movie showcasing the zoom-in version of the core region (left, see Movie 1 online) and the entire jet region (right, see Movie 2 online). The cyan cross indicates the assumed position of the core, whereas the magenta crosses indicate the positions of the knot identified by WISE. Top-left corner displays a white bar indicating the monitoring period, while the blue circle within the bar denotes the time of observation in each epoch. Bottom-left corner features white crosses representing the synthesized beam size used for convolving the individual epoch images.
Current usage metrics show cumulative count of Article Views (full-text article views including HTML views, PDF and ePub downloads, according to the available data) and Abstracts Views on Vision4Press platform.
Data correspond to usage on the plateform after 2015. The current usage metrics is available 48-96 hours after online publication and is updated daily on week days.
Initial download of the metrics may take a while.