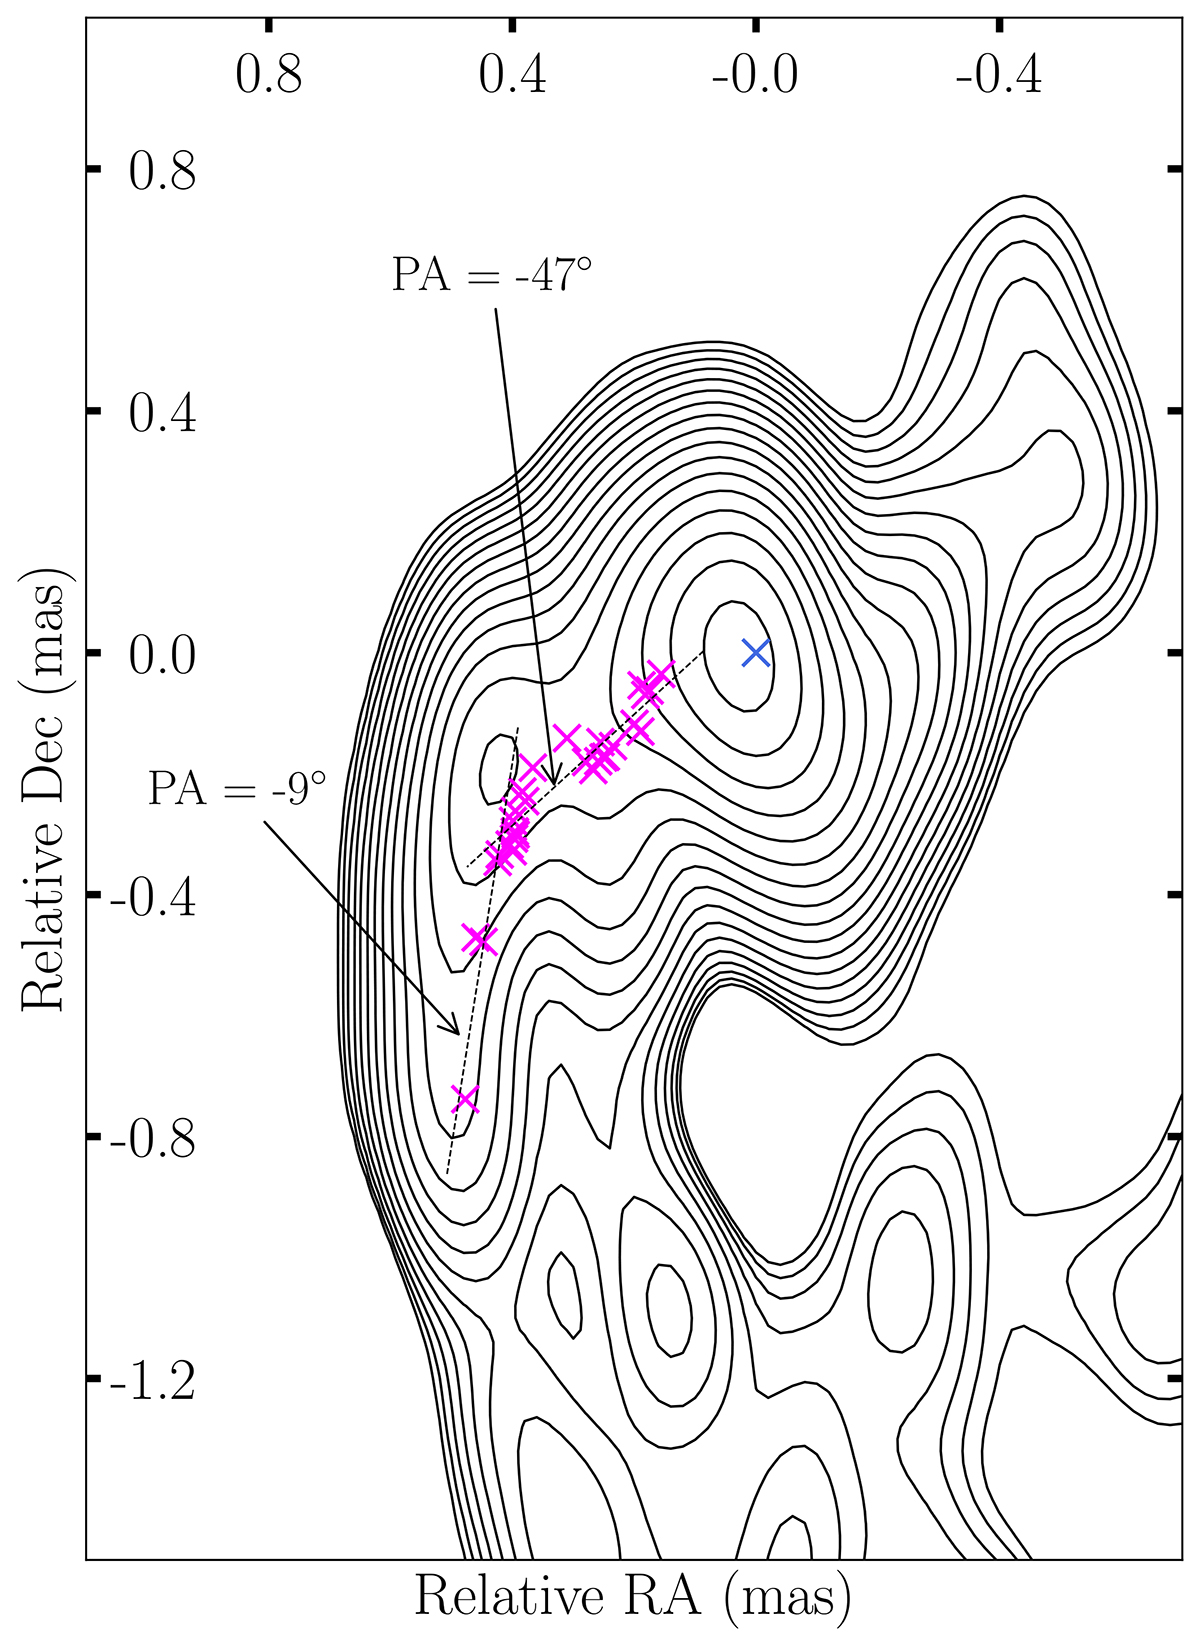
Fig. 3.
Download original image
Contours of the total intensity image of 3C 84 observed at 43 GHz with the VLBA on November 1, 2022. The blue cross indicates the assumed position of the core, coinciding with the map origin. The magenta crosses indicate the positions of the knot, which underwent ejection from the core in the late 2010s (Punsly et al. 2021) and displayed a notable variation in its apparent position angle during the early 2020s.
Current usage metrics show cumulative count of Article Views (full-text article views including HTML views, PDF and ePub downloads, according to the available data) and Abstracts Views on Vision4Press platform.
Data correspond to usage on the plateform after 2015. The current usage metrics is available 48-96 hours after online publication and is updated daily on week days.
Initial download of the metrics may take a while.