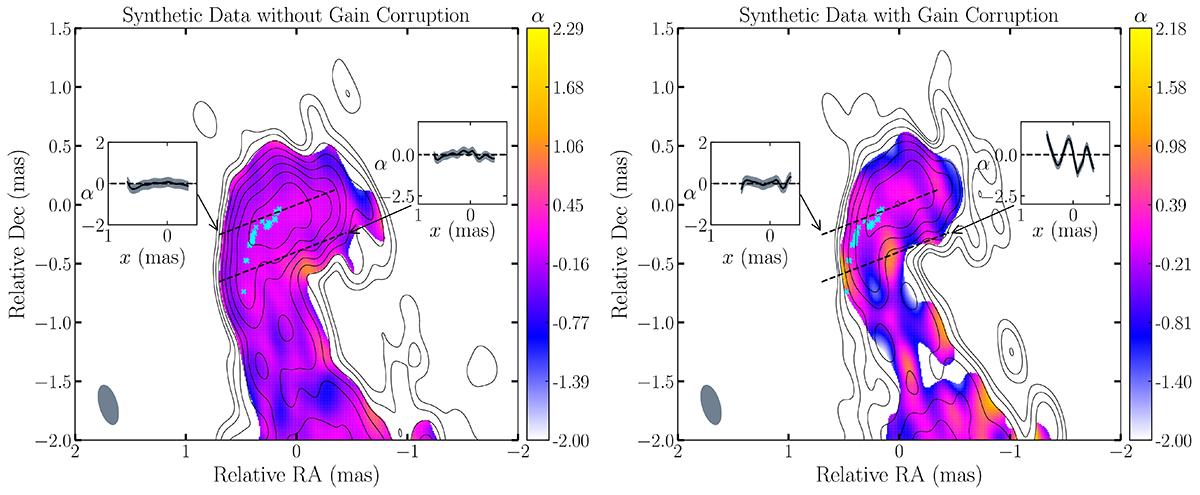
Fig. F.1.
Download original image
Spectral index maps generated by applying the identical analysis as conducted in Section 3.2, but using synthetic data without (left) and with (right) gain corruptions. Deviation from a zero spectral index can be ascribed to different (u, v) coverage between the 22 and 43 GHz data, along with imperfections in gain calibration and imaging procedures. While deviations are indeed evident in certain regions of the jet, particularly in the image on the right due to gain corruptions, there is no indication of a significantly inverted spectrum near the knot’s deflection point, as observed in the real data.
Current usage metrics show cumulative count of Article Views (full-text article views including HTML views, PDF and ePub downloads, according to the available data) and Abstracts Views on Vision4Press platform.
Data correspond to usage on the plateform after 2015. The current usage metrics is available 48-96 hours after online publication and is updated daily on week days.
Initial download of the metrics may take a while.