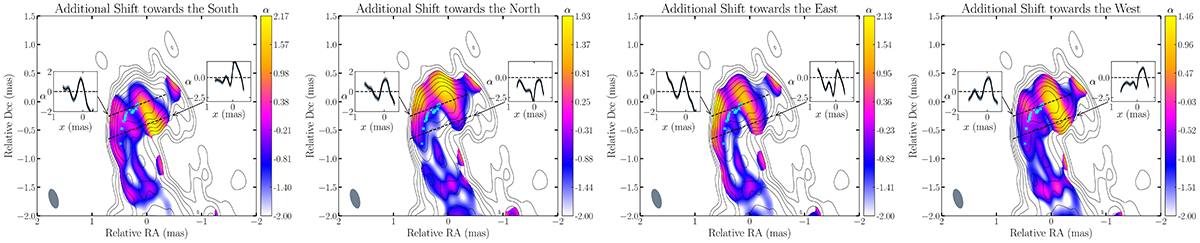
Fig. E.1.
Download original image
Spectral index maps were generated using the same analysis techniques as detailed in Section 3.2. However, in this analysis, we introduced an additional shift in the 43 GHz image in multiple directions, including south, north, east, and west (from left to right). Each shift was approximately 1/4 of the synthesized beam size in its respective direction. Cyan crosses indicate the position of the knot identified through WISE analysis. Notably, the presence of the inverted spectral region near the knot’s deflection point persists even when there is a substantial amount of image misalignment. However, it’s worth mentioning that, in some cases, the contrast is somewhat reduced compared to the original spectral index map (see Figure 6).
Current usage metrics show cumulative count of Article Views (full-text article views including HTML views, PDF and ePub downloads, according to the available data) and Abstracts Views on Vision4Press platform.
Data correspond to usage on the plateform after 2015. The current usage metrics is available 48-96 hours after online publication and is updated daily on week days.
Initial download of the metrics may take a while.