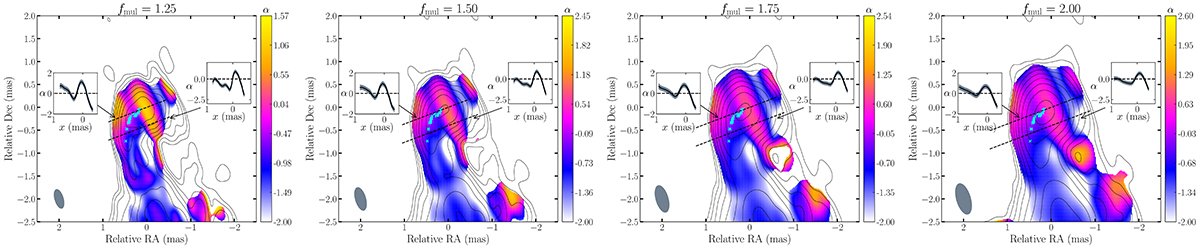
Fig. D.1.
Download original image
Spectral index maps generated by applying the identical analysis as conducted in Section 3.2, but using the 22 and 43 GHz images with a restoring beam size equal to the original beam size multiplied by fmul. The results for fmul = 1.25, 1.50, 1.75, 2.00 are displayed from left to right. The position of the knot identified through WISE analysis is indicated by cyan crosses. The presence of the inverted spectral region near the knot’s deflection point persists even with a larger restoring beam size, although the contrast diminishes in comparison to the original spectral index map (Figure 6).
Current usage metrics show cumulative count of Article Views (full-text article views including HTML views, PDF and ePub downloads, according to the available data) and Abstracts Views on Vision4Press platform.
Data correspond to usage on the plateform after 2015. The current usage metrics is available 48-96 hours after online publication and is updated daily on week days.
Initial download of the metrics may take a while.