Fig. A.1.
Download original image
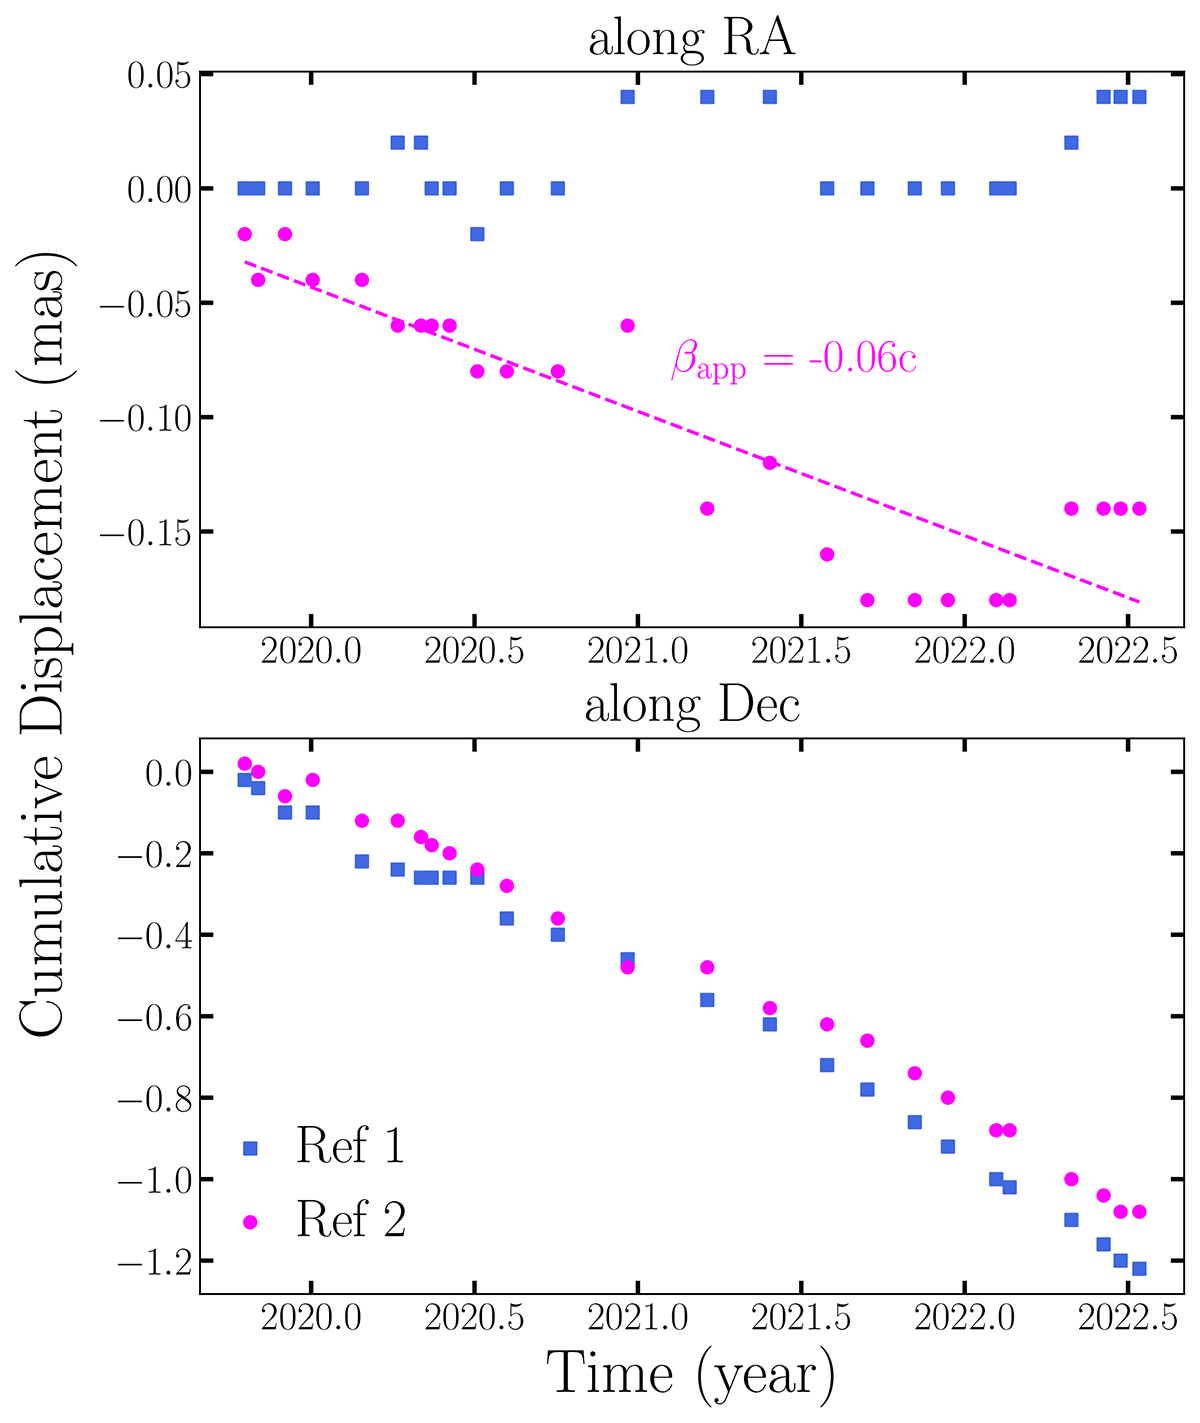
Cumulative displacement as a function of time, maximizing the cross-correlation coefficients of the downstream jet emission located at a declination less than −1.5 mas between each pair of successive epochs, shown for the right ascension direction (top) and declination direction (bottom). The blue data points corresponds to the result obtained by assuming the western component in the core region as the stationary core (Ref 1), while the magenta data points corresponds to the result obtained by assuming the eastern component, identified through WISE analysis, as the stationary core (Ref 2).
Current usage metrics show cumulative count of Article Views (full-text article views including HTML views, PDF and ePub downloads, according to the available data) and Abstracts Views on Vision4Press platform.
Data correspond to usage on the plateform after 2015. The current usage metrics is available 48-96 hours after online publication and is updated daily on week days.
Initial download of the metrics may take a while.