Fig. 12.
Download original image
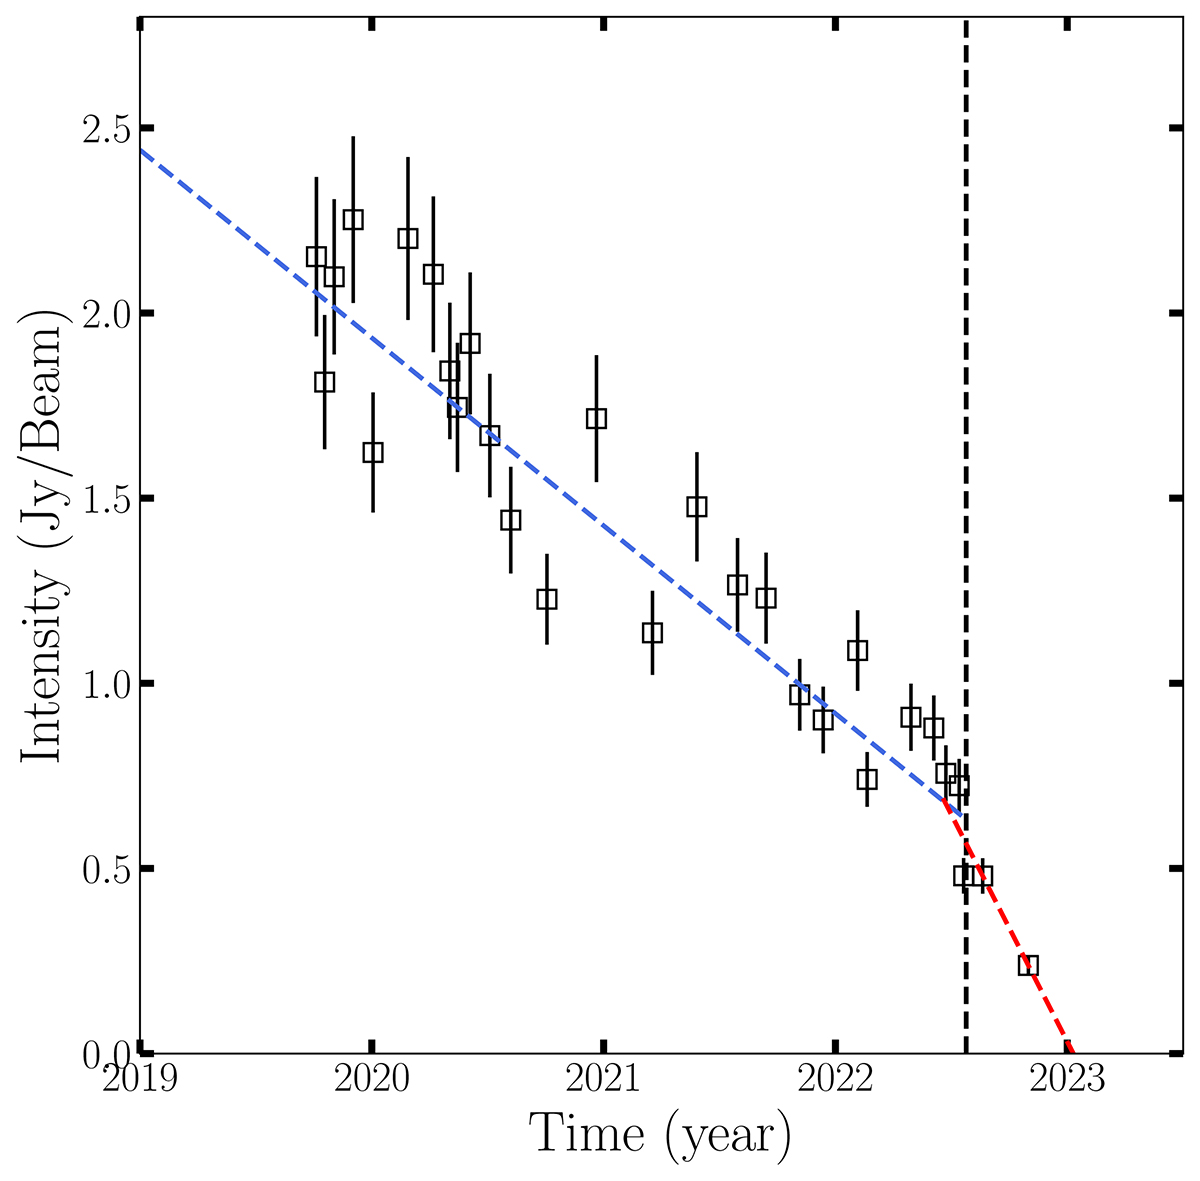
Total intensity of the knot, measured in Jy per beam, is plotted against time. The uncertainties are obtained by combining the image rms errors and the 10% systematic errors arising from the uncertainties in visibility amplitudes through quadrature. The blue and red dashed lines represent the best-fit linear functions for the observed intensities prior to and after mid-2022 (indicated by the black vertical dashed line), respectively. This transition coincides with a sudden acceleration in the knot’s apparent speed.
Current usage metrics show cumulative count of Article Views (full-text article views including HTML views, PDF and ePub downloads, according to the available data) and Abstracts Views on Vision4Press platform.
Data correspond to usage on the plateform after 2015. The current usage metrics is available 48-96 hours after online publication and is updated daily on week days.
Initial download of the metrics may take a while.