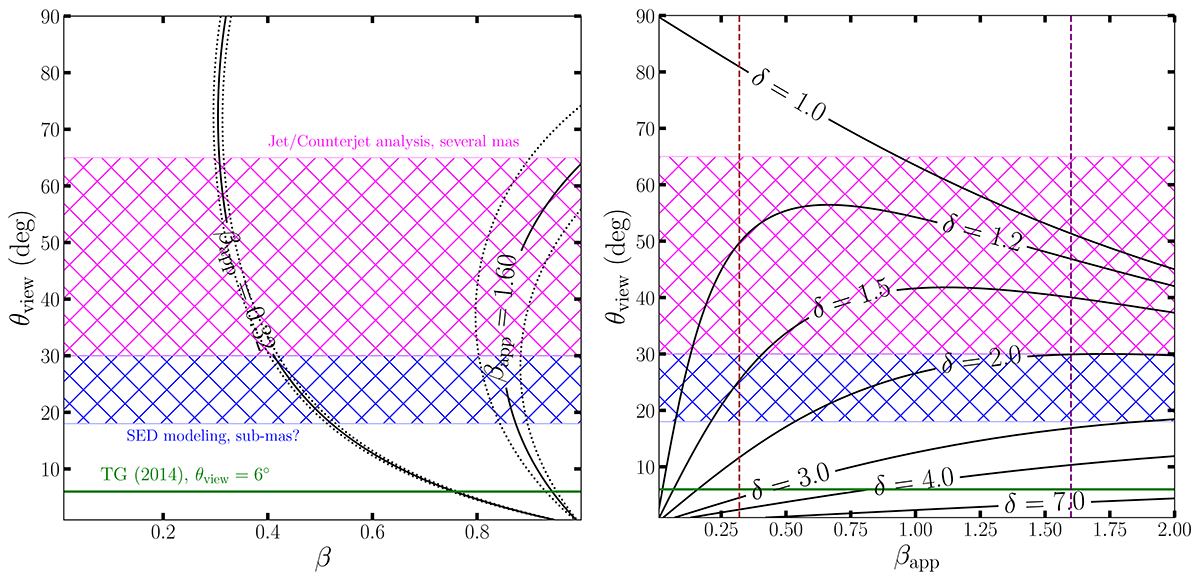
Fig. 11.
Download original image
Contours denoting βapp = 0.32 and 1.60 as a function of β and θview, represented by solid black lines (left). The contours corresponding to the apparent speed values deviated by 1σ errors are depicted by dotted black lines. The blue hashed region indicates the inferred range of jet viewing angles, θview = 18 − 30°, based on previous studies employing SED modeling (Abdo et al. 2009; Aleksić et al. 2014; Tavecchio & Ghisellini 2014). Similarly, the red hashed region represents the range of θview = 30 − 65° inferred from observations of the counterjet (Walker et al. 1994; Asada et al. 2006; Fujita & Nagai 2017). The green solid line emphasizes a viewing angle of 6°, which yielded a satisfactory fit to the observed SED but was considered unreliable due to its significant deviation from the viewing angles determined through radio observations (Tavecchio & Ghisellini 2014). Contours corresponding to various values of the Doppler factor δ are presented as functions of βapp and θview (right). The vertical dashed lines indicate the observed apparent speeds of the knot, βapp = 0.32 and 1.60.
Current usage metrics show cumulative count of Article Views (full-text article views including HTML views, PDF and ePub downloads, according to the available data) and Abstracts Views on Vision4Press platform.
Data correspond to usage on the plateform after 2015. The current usage metrics is available 48-96 hours after online publication and is updated daily on week days.
Initial download of the metrics may take a while.