Fig. 6
Download original image
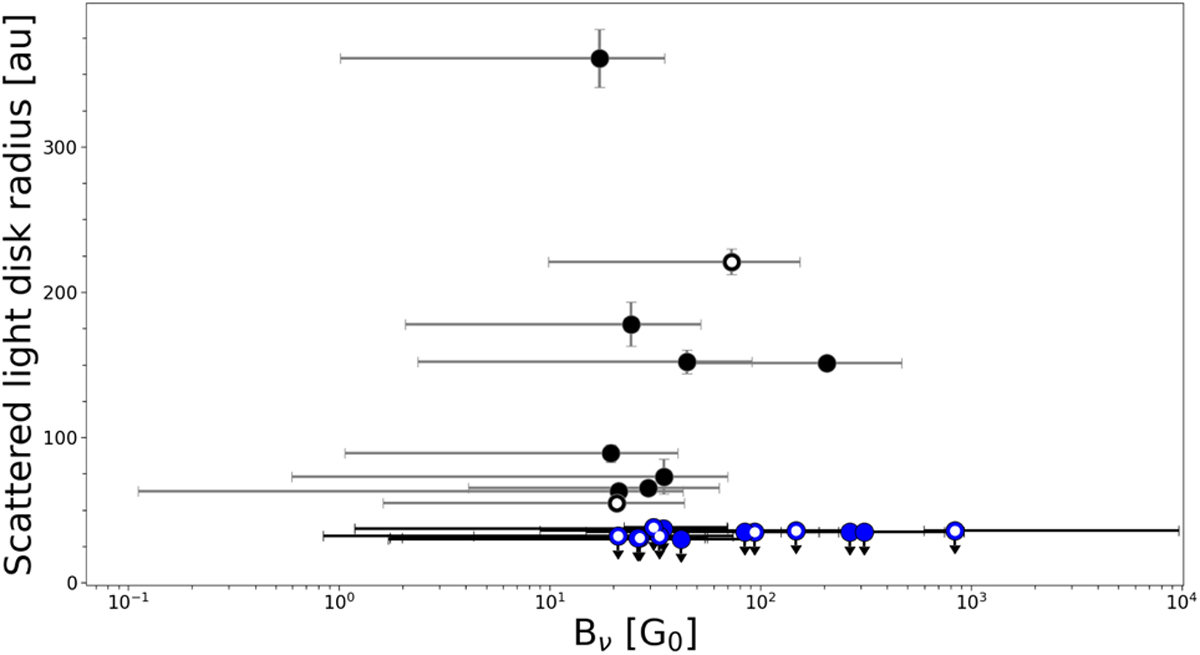
Graph showing the disk radius of each source in the FUV field of the three O stars, θ1 Ori, σ Ori, and NU Ori. Local extinction has not been taken into account. Systems with detected disks are black and systems without a detected disk are blue. Upper limits for non-detections were derived using the angular size of the coronagraph. Binary systems are indicated with a white marker. No disks are detected at FUV fields higher than ~300 G0.
Current usage metrics show cumulative count of Article Views (full-text article views including HTML views, PDF and ePub downloads, according to the available data) and Abstracts Views on Vision4Press platform.
Data correspond to usage on the plateform after 2015. The current usage metrics is available 48-96 hours after online publication and is updated daily on week days.
Initial download of the metrics may take a while.