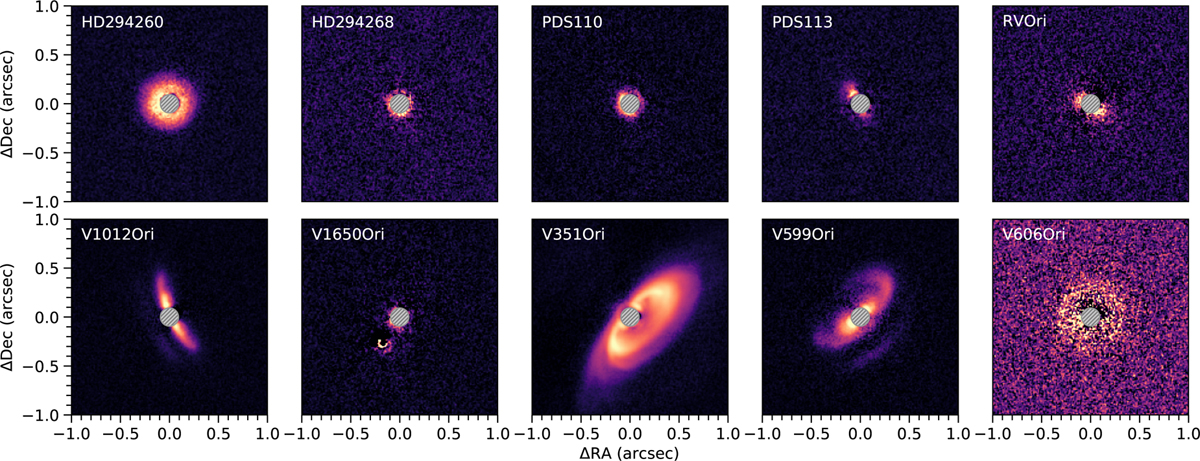
Fig. 2
Download original image
All disks detected in our SPHERE H-band data. We show the Qϕ (azimuthally) polarized light images in all cases. All systems are shown on a logarithmic color map, individually adjusted to highlight the disk morphology. The hashed gray circle in the center of the images indicates the position and size of the coronagraphic mask (centered on the system’s primary star.)
Current usage metrics show cumulative count of Article Views (full-text article views including HTML views, PDF and ePub downloads, according to the available data) and Abstracts Views on Vision4Press platform.
Data correspond to usage on the plateform after 2015. The current usage metrics is available 48-96 hours after online publication and is updated daily on week days.
Initial download of the metrics may take a while.