Fig. 1
Download original image
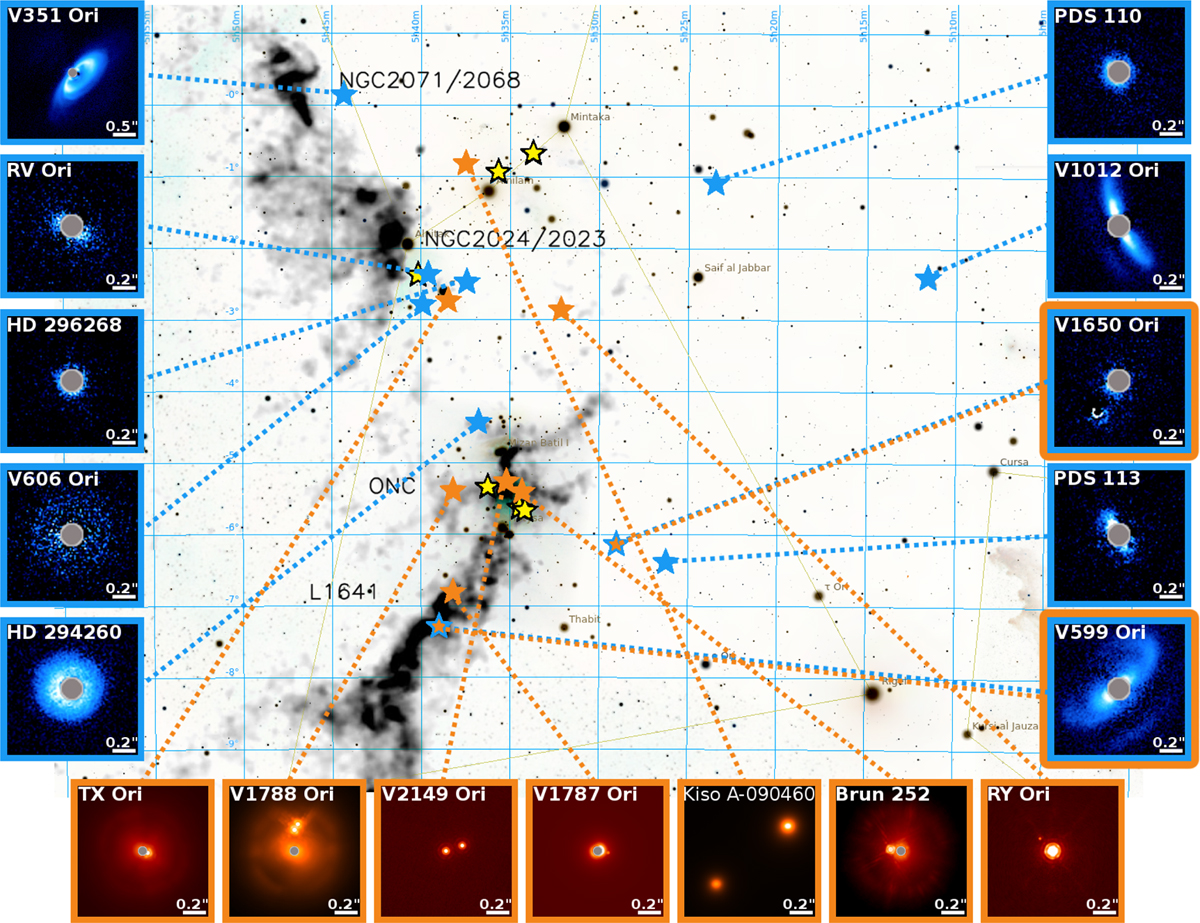
Imagery of the sample. The figure shows a stellar map with the location of the sources in this paper. The thumbnails show disk detections (blue), detected companions (orange), and non-disk detections (yellow.) The extent of the coronagraph is displayed as a gray circle in each thumbnail when used. The stellar map was generated with Stellarium (open source software https://stellarium.org/) and the IR extinction map (dark gray clouds) was adapted from Megeath et al. (2012) based on Gutermuth et al. (2011).
Current usage metrics show cumulative count of Article Views (full-text article views including HTML views, PDF and ePub downloads, according to the available data) and Abstracts Views on Vision4Press platform.
Data correspond to usage on the plateform after 2015. The current usage metrics is available 48-96 hours after online publication and is updated daily on week days.
Initial download of the metrics may take a while.