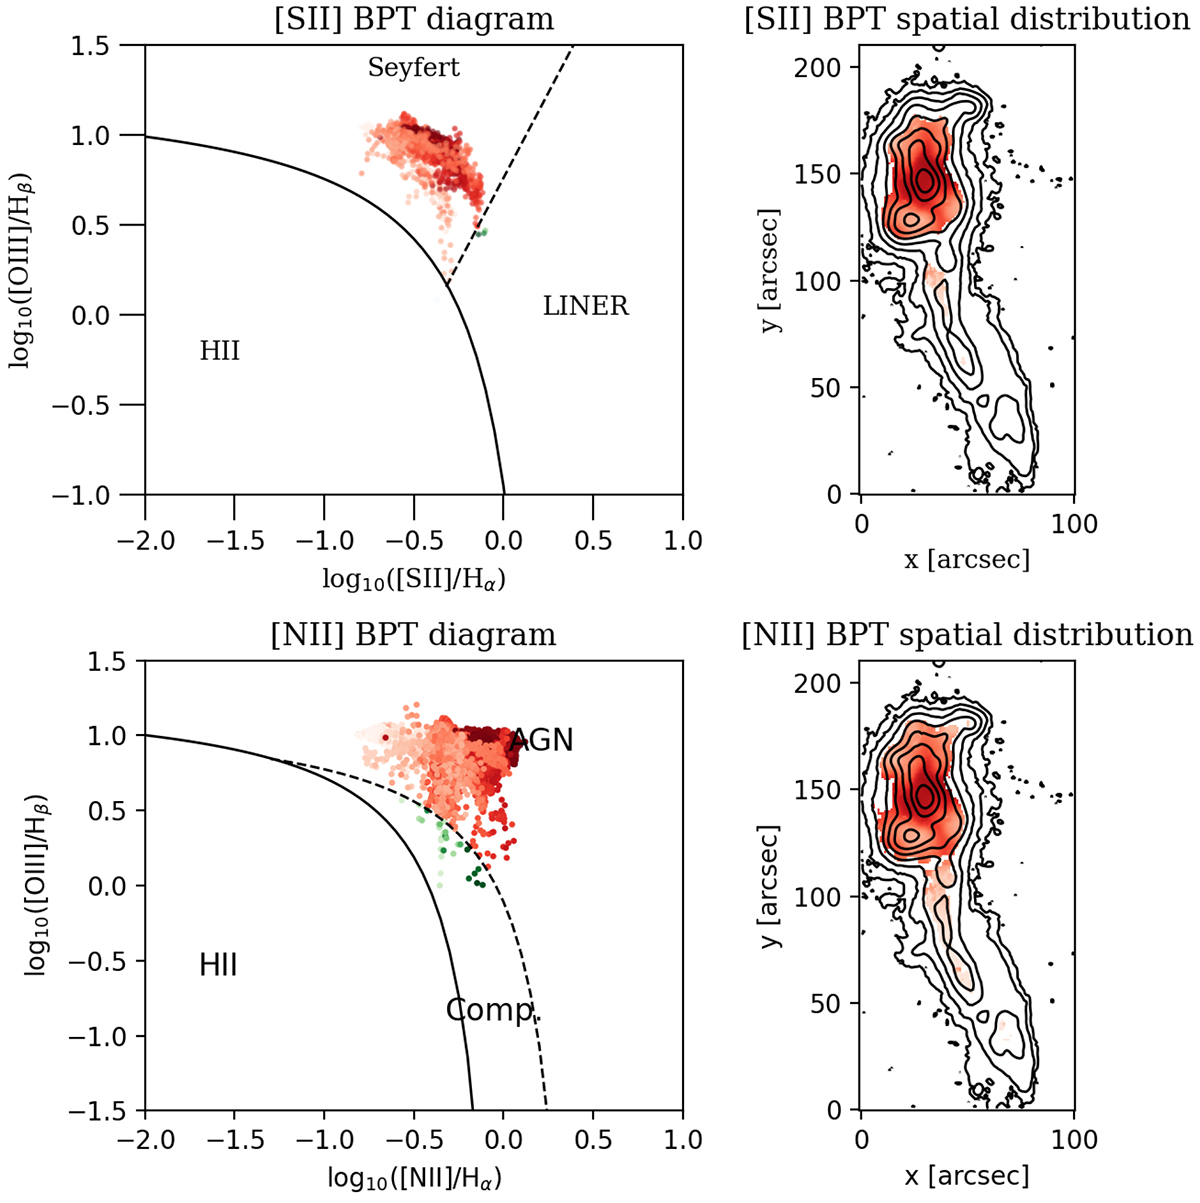
Fig. 5.
Download original image
Resolved S-BPT ([OIII]/Hβ vs. [SII]λ6716,6731/Hα) (top) and N-BPT ([OIII]/Hβ vs. [NII]λ6584/Hα) diagrams (bottom) of J1000+1242 for each spaxel with S/N > 3 in each line. The solid curves define the theoretical upper bound for the HII regions (Kewley et al. 2001). The dashed line in S-BPT represents the Kewley et al. (2006) demarcation between Seyfert galaxies and shocks or LINERs. The dashed curve in N-BPT represents the empirical classification by Kauffmann et al. (2003) to divide pure star-forming from Seyfert–H II composite objects. The black contours represent the moment 0 of Hα. The data points on the BPT diagram are colored differently to distinguish different regions. The intensity of the color is proportional to the moment 2 of [OIII].
Current usage metrics show cumulative count of Article Views (full-text article views including HTML views, PDF and ePub downloads, according to the available data) and Abstracts Views on Vision4Press platform.
Data correspond to usage on the plateform after 2015. The current usage metrics is available 48-96 hours after online publication and is updated daily on week days.
Initial download of the metrics may take a while.