Fig. 3.
Download original image
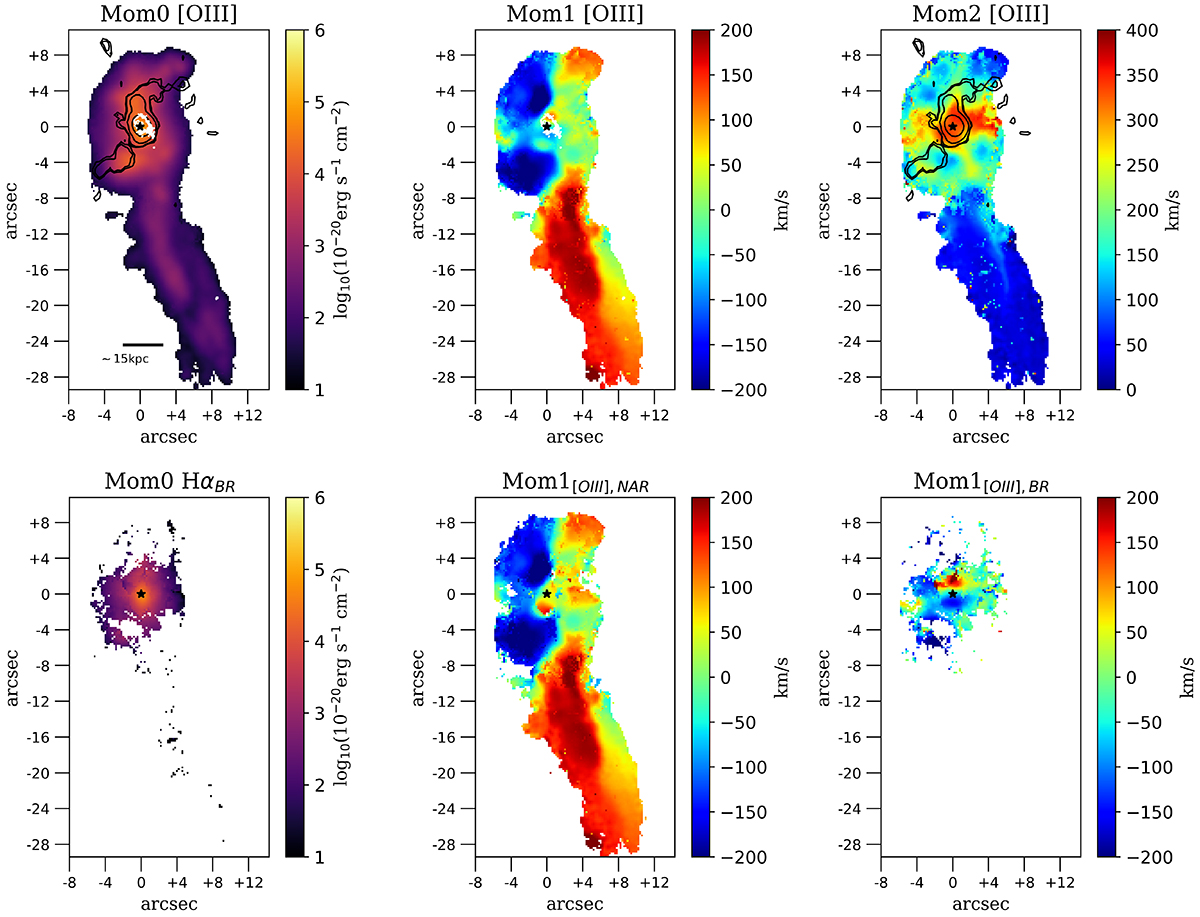
Kinematics of the [OIII] line emission in J1000+1242. The upper panels show the flux (moment 0), velocity (moment 1), and velocity dispersion (moment 2) of the whole line profile. The lower panels show the flux of the broad component of Hα, the velocity of the [OIII] narrow component (middle), and the velocity of the [OIII] broad component (right) obtained by decoupling the line profile. The black stars indicate the centers of the AGN. The black contours of VLA 6 GHz low resolution (∼1″ beam) vary from 0.07 to 2 mJy beam−1. The white contours represent the HST continuum. An S/N cut of 3 has been applied to the maps for each line.
Current usage metrics show cumulative count of Article Views (full-text article views including HTML views, PDF and ePub downloads, according to the available data) and Abstracts Views on Vision4Press platform.
Data correspond to usage on the plateform after 2015. The current usage metrics is available 48-96 hours after online publication and is updated daily on week days.
Initial download of the metrics may take a while.