Fig. 2.
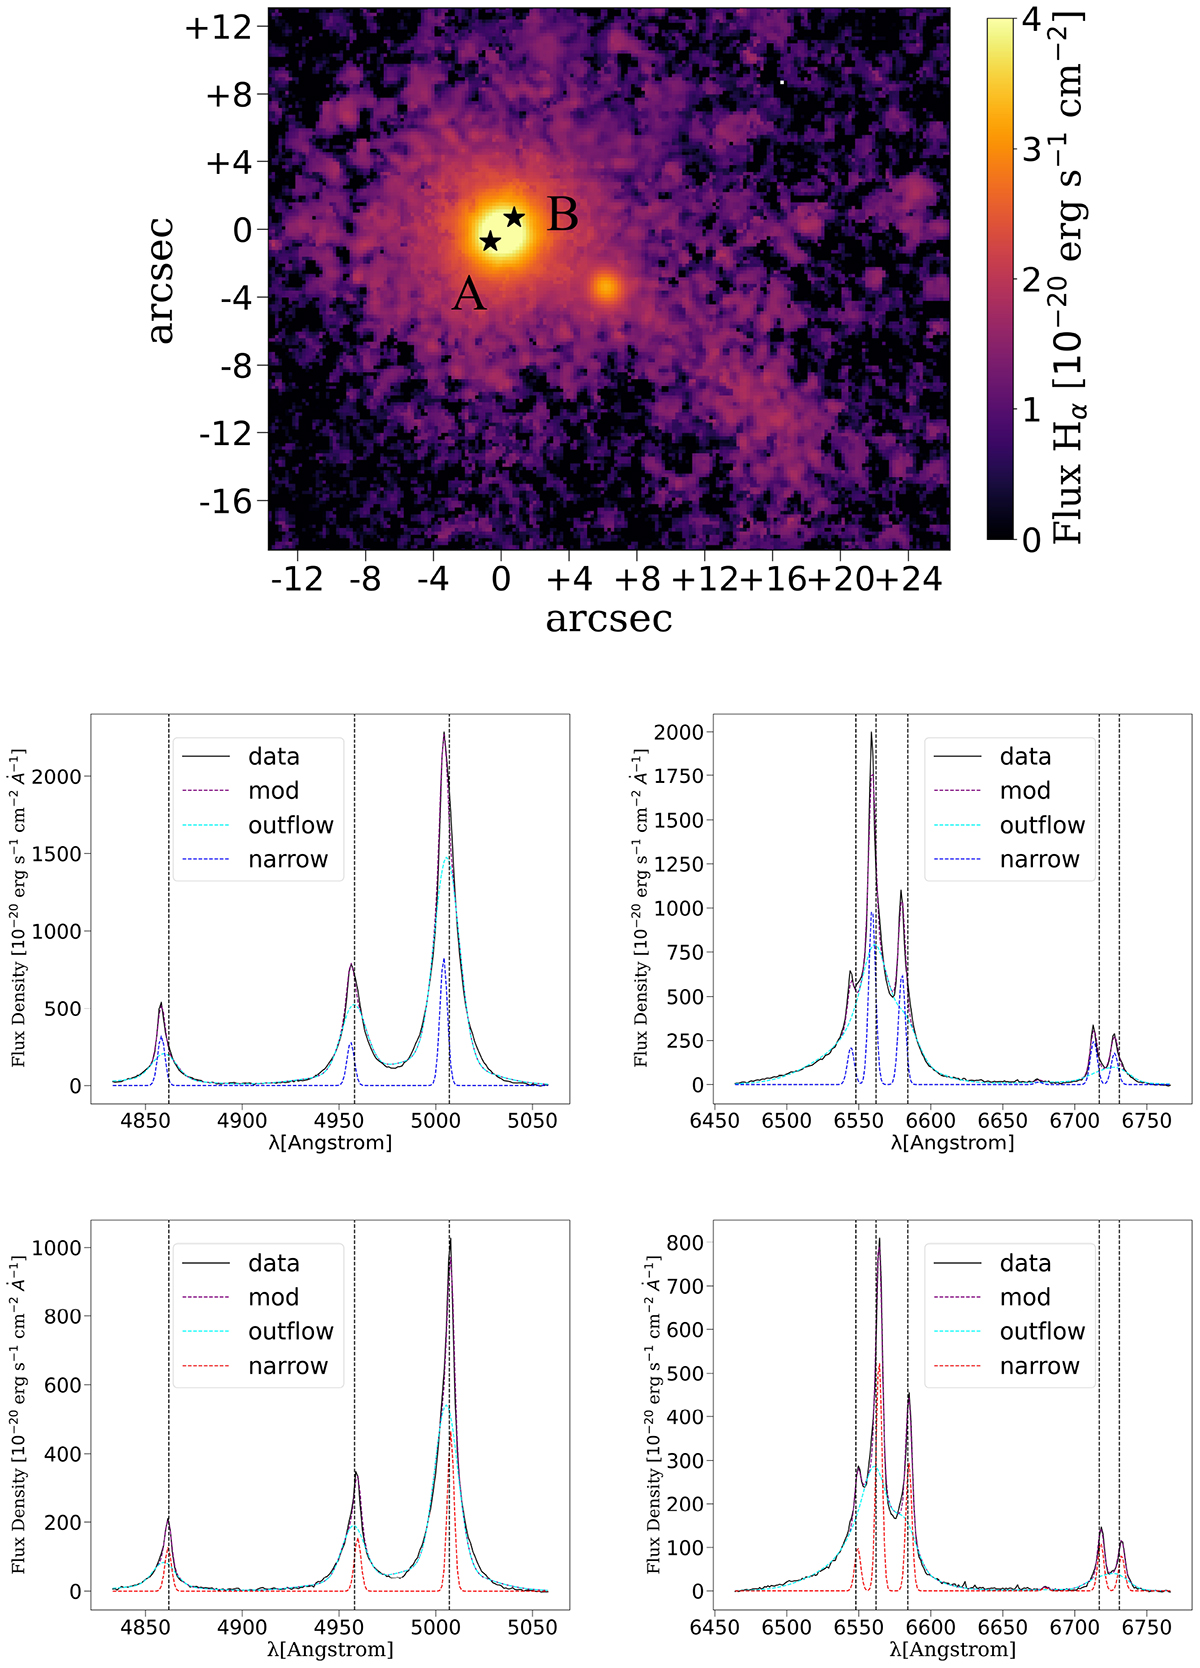
Download original image
Upper panel: flux density map of J1010+0612 from MUSE. Bottom panels: spectra extracted from regions A and B marked with the black stars in the upper panel. The first column shows the spectral range that includes Hβ and [OIII] doublet, and the second column displays the range that includes the Hα, [NII], and [SII] doublets. The black lines represent the data subtracted from the continuum emission, as described in Sect. 2, the purple lines show the total model, the cyan lines show the broad components, and the red (up) and blue (bottom) lines show the narrow components obtained by decoupling the line profiles, as described in Sect. 3.
Current usage metrics show cumulative count of Article Views (full-text article views including HTML views, PDF and ePub downloads, according to the available data) and Abstracts Views on Vision4Press platform.
Data correspond to usage on the plateform after 2015. The current usage metrics is available 48-96 hours after online publication and is updated daily on week days.
Initial download of the metrics may take a while.