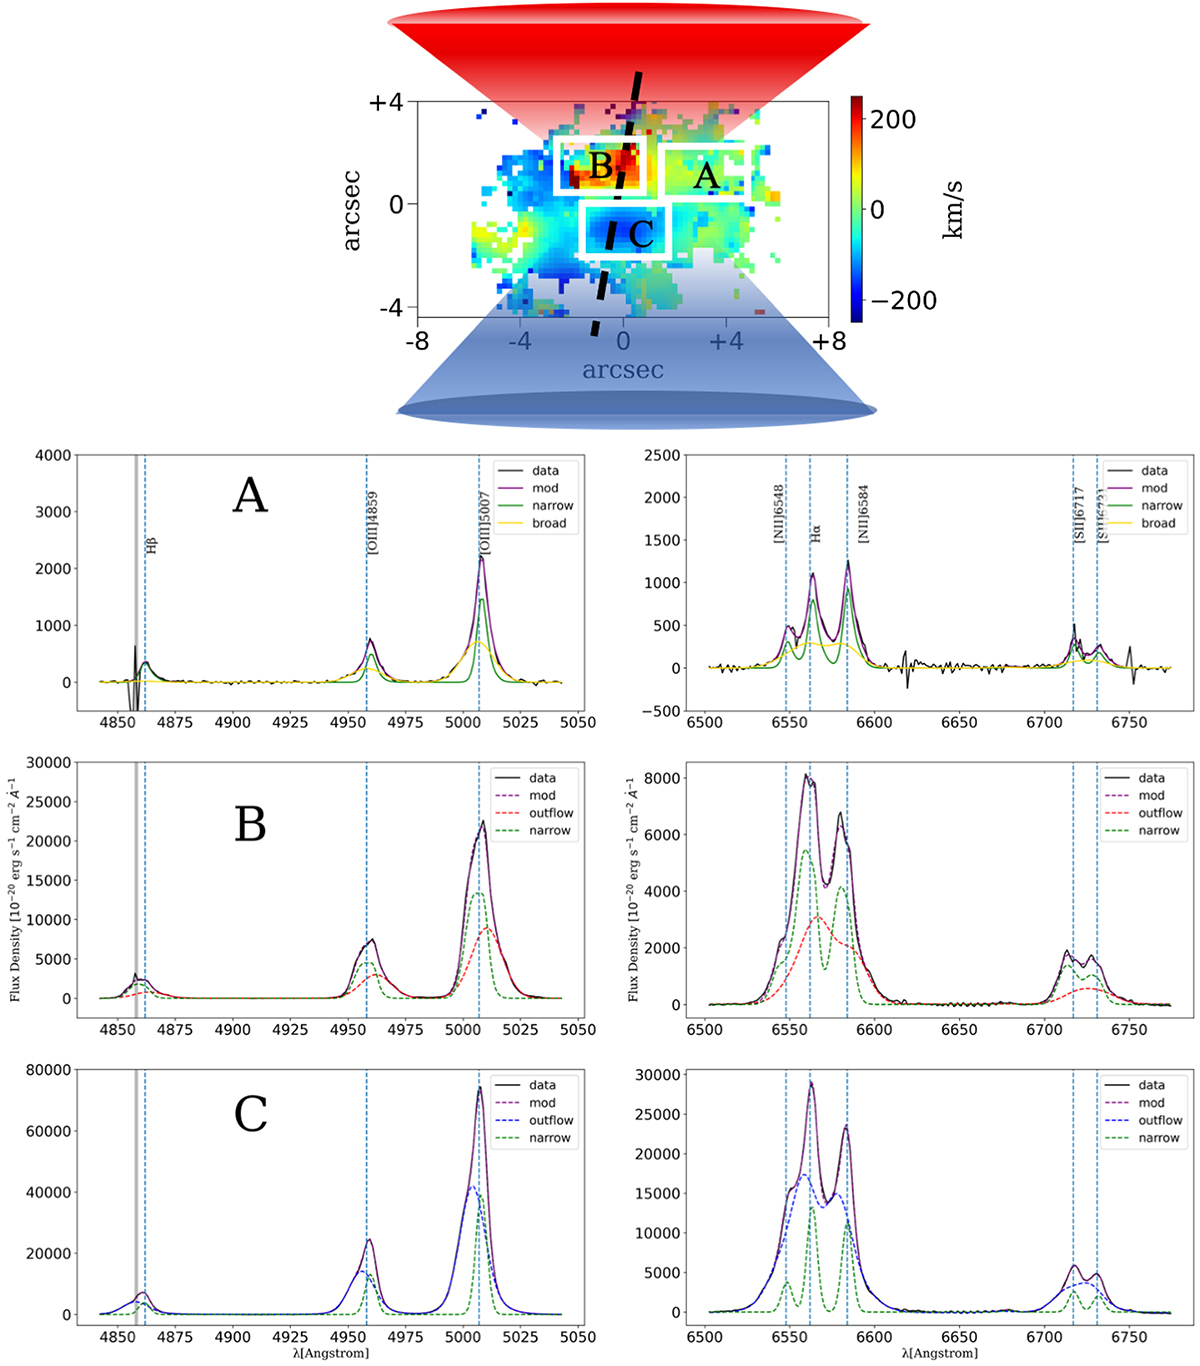
Fig. 15.
Download original image
Upper panel: Velocity of the broad component V[OIII],BR in J1000+1242, also reported in Fig. 3, zoomed in the central region. The axis of the outflowing bicone (traced by the red- and blueshifted motions in regions B and C, respectively) is parallel to that of the radio jet and ionization cones, while turbulent gas is located perpendicular to this (region A). The dashed black lines indicate the ionization cone in which the outflow is detected. The dashed black line indicates the direction of the radio jet. Bottom panels: integrated spectra extracted from the white rectangles in the corresponding subregions (A, B, and C) in the upper panel. Left panels: Hβ, [OIII] doublet. Right panels: Hα and the [NII] and [SII] doublets. The data are shown in black, the total best-fitting model is shown in purple, the narrow component is plotted in green, the broad component in region A tracing turbulent gas is shown in yellow, the redshifted outflow is shown in red, and the blueshifted outflow is shown in blue. The shaded gray area indicates the region that was excluded from the fit because the sky subtraction was too poor.
Current usage metrics show cumulative count of Article Views (full-text article views including HTML views, PDF and ePub downloads, according to the available data) and Abstracts Views on Vision4Press platform.
Data correspond to usage on the plateform after 2015. The current usage metrics is available 48-96 hours after online publication and is updated daily on week days.
Initial download of the metrics may take a while.