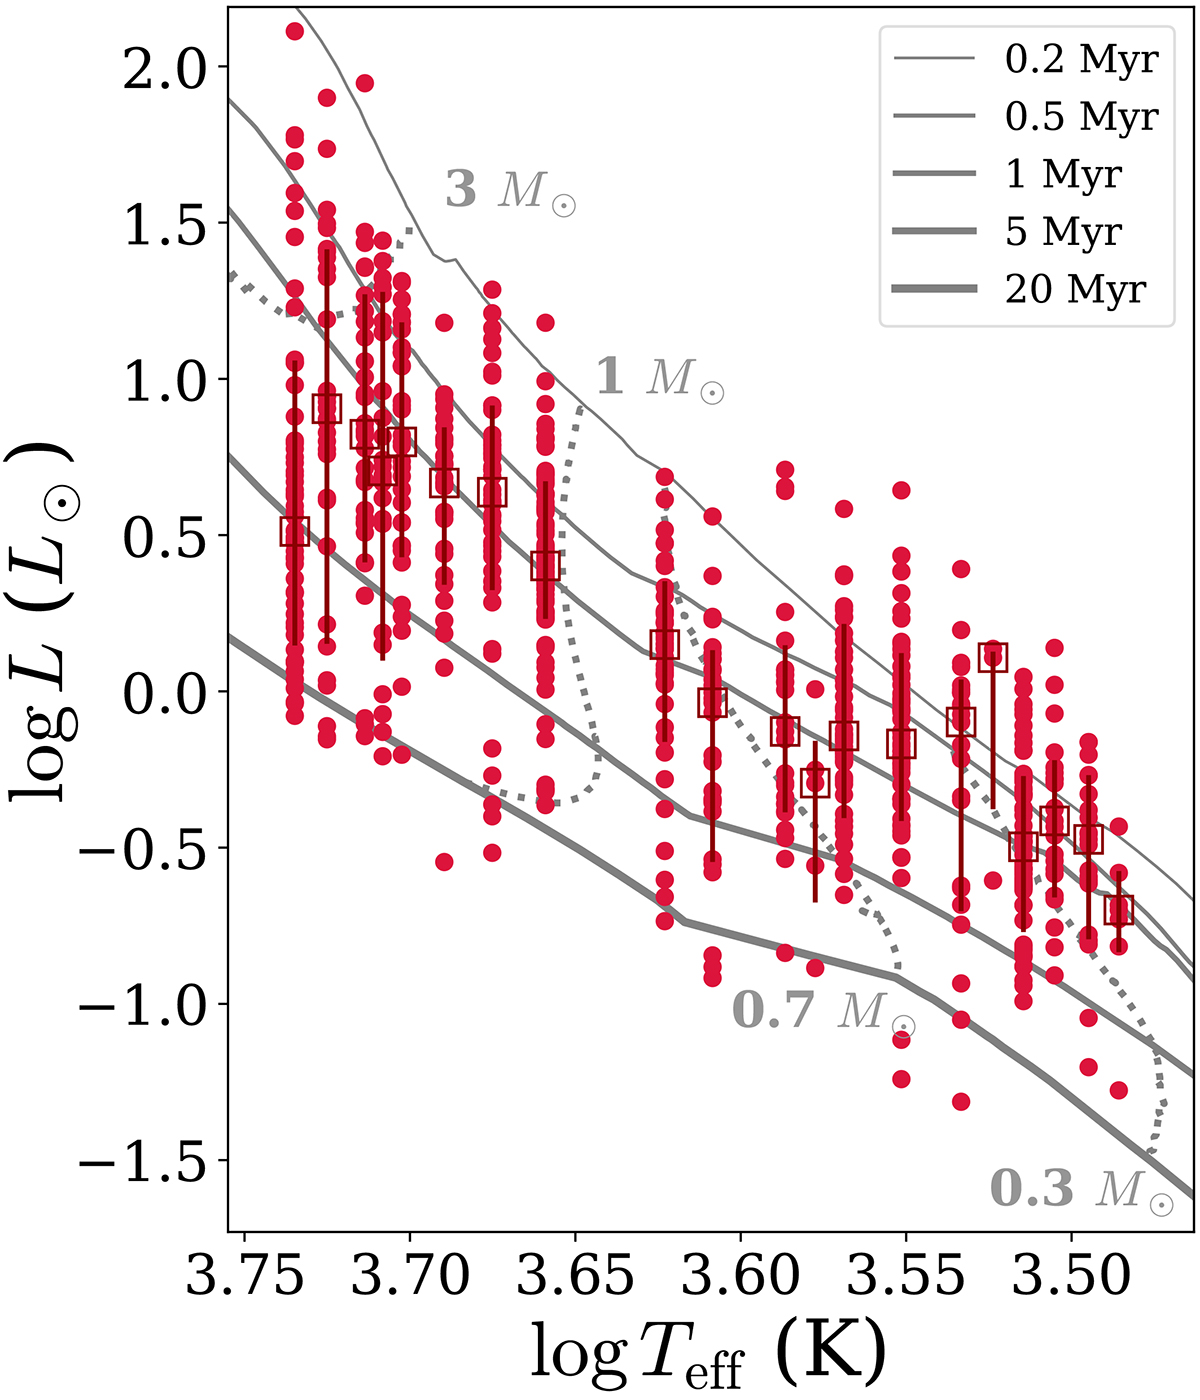
Fig. 9.
Download original image
HR diagram for low-mass stars of Tr 14. Filled circles show data points. Empty squares are the median values of the bolometric luminosity for each spectral subclass, with error bars indicating 1-σ percentiles. Theoretical tracks from Bressan et al. (2012) are shown as solid black lines. Dotted grey lines show tracks for 0.3, 0.7, 1, and 3 M⊙ stars.
Current usage metrics show cumulative count of Article Views (full-text article views including HTML views, PDF and ePub downloads, according to the available data) and Abstracts Views on Vision4Press platform.
Data correspond to usage on the plateform after 2015. The current usage metrics is available 48-96 hours after online publication and is updated daily on week days.
Initial download of the metrics may take a while.