Fig. 8.
Download original image
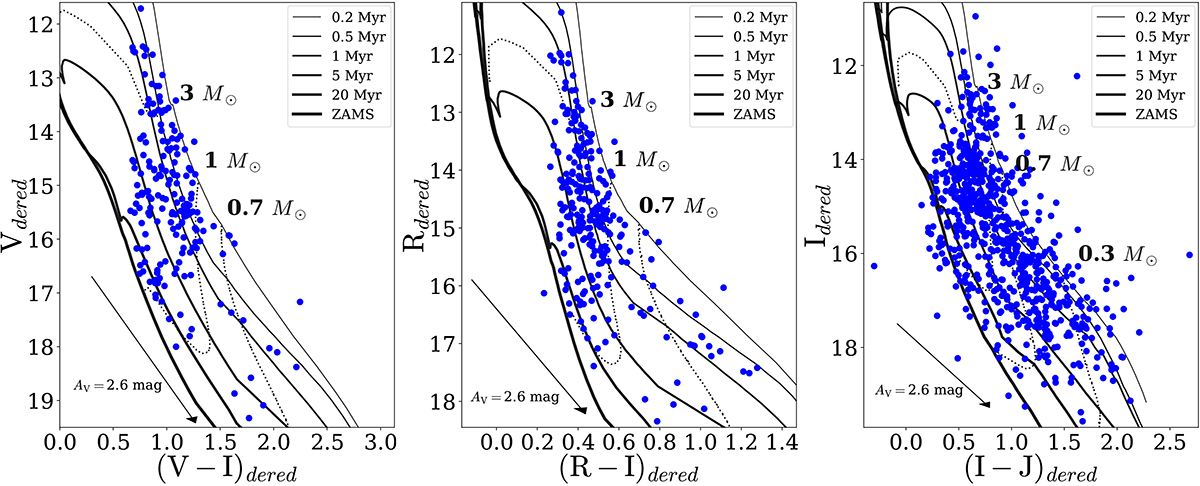
Colour–magnitude diagrams from MUSE broadband filters images in V and I (left panel), R and I magnitudes (middle panel), and I and J magnitudes (right panel) corrected for individual extinction. J-band magnitudes are from the VISTA and HAWK-I observations. Reddening vectors in the lower left corners show reddening by a median value of AV estimated for Tr 14. Solid lines show isochrones from 0.2 to 20 Myr (and ZAMS); dotted lines show isomasses of 0.3, 0.7, 1, and 3 M⊙, as labeled (Bressan et al. 2012).
Current usage metrics show cumulative count of Article Views (full-text article views including HTML views, PDF and ePub downloads, according to the available data) and Abstracts Views on Vision4Press platform.
Data correspond to usage on the plateform after 2015. The current usage metrics is available 48-96 hours after online publication and is updated daily on week days.
Initial download of the metrics may take a while.