Fig. 4.
Download original image
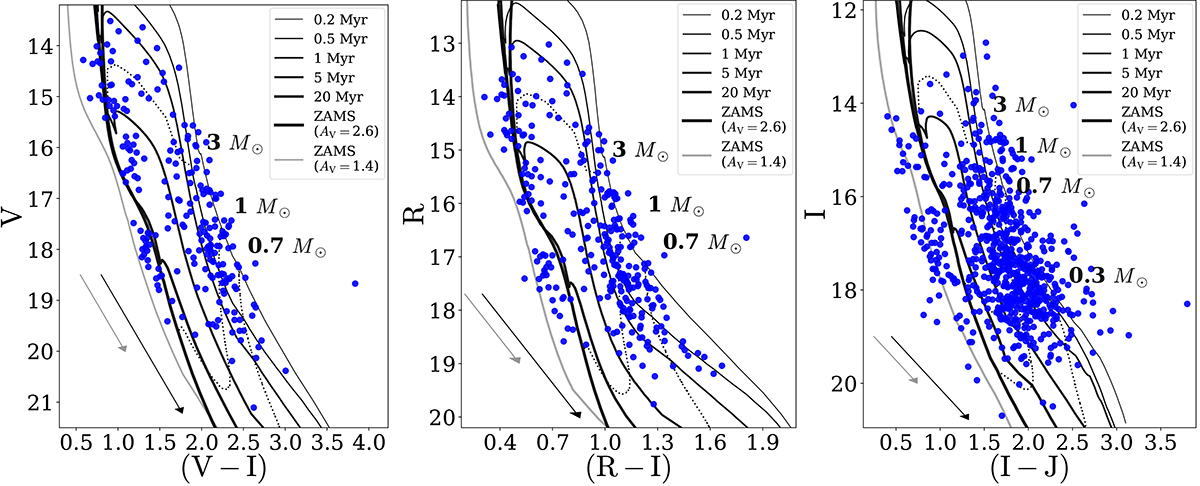
Colour–magnitude diagrams from MUSE broadband filters images in V and I (right panel), R and I magnitudes (middle panel), and I and J magnitudes (left panel). J band magnitudes are from VISTA and HAWK-I instruments. Shown are only data points with I band magnitudes above 3σ. Solid lines show PARSEC isochrones from 0.2 to 20 Myr and ZAMS, dotted lines show isomasses of 0.3, 0.7, 1, and 3 M⊙, as labeled (Bressan et al. 2012). Isochrones were reddened by the average extinction AV = 2.6 mag measured from MUSE spectra (see Sect. 3.4). Additionally, we plot the ZAMS reddened by AV = 1.4 mag with grey lines.
Current usage metrics show cumulative count of Article Views (full-text article views including HTML views, PDF and ePub downloads, according to the available data) and Abstracts Views on Vision4Press platform.
Data correspond to usage on the plateform after 2015. The current usage metrics is available 48-96 hours after online publication and is updated daily on week days.
Initial download of the metrics may take a while.