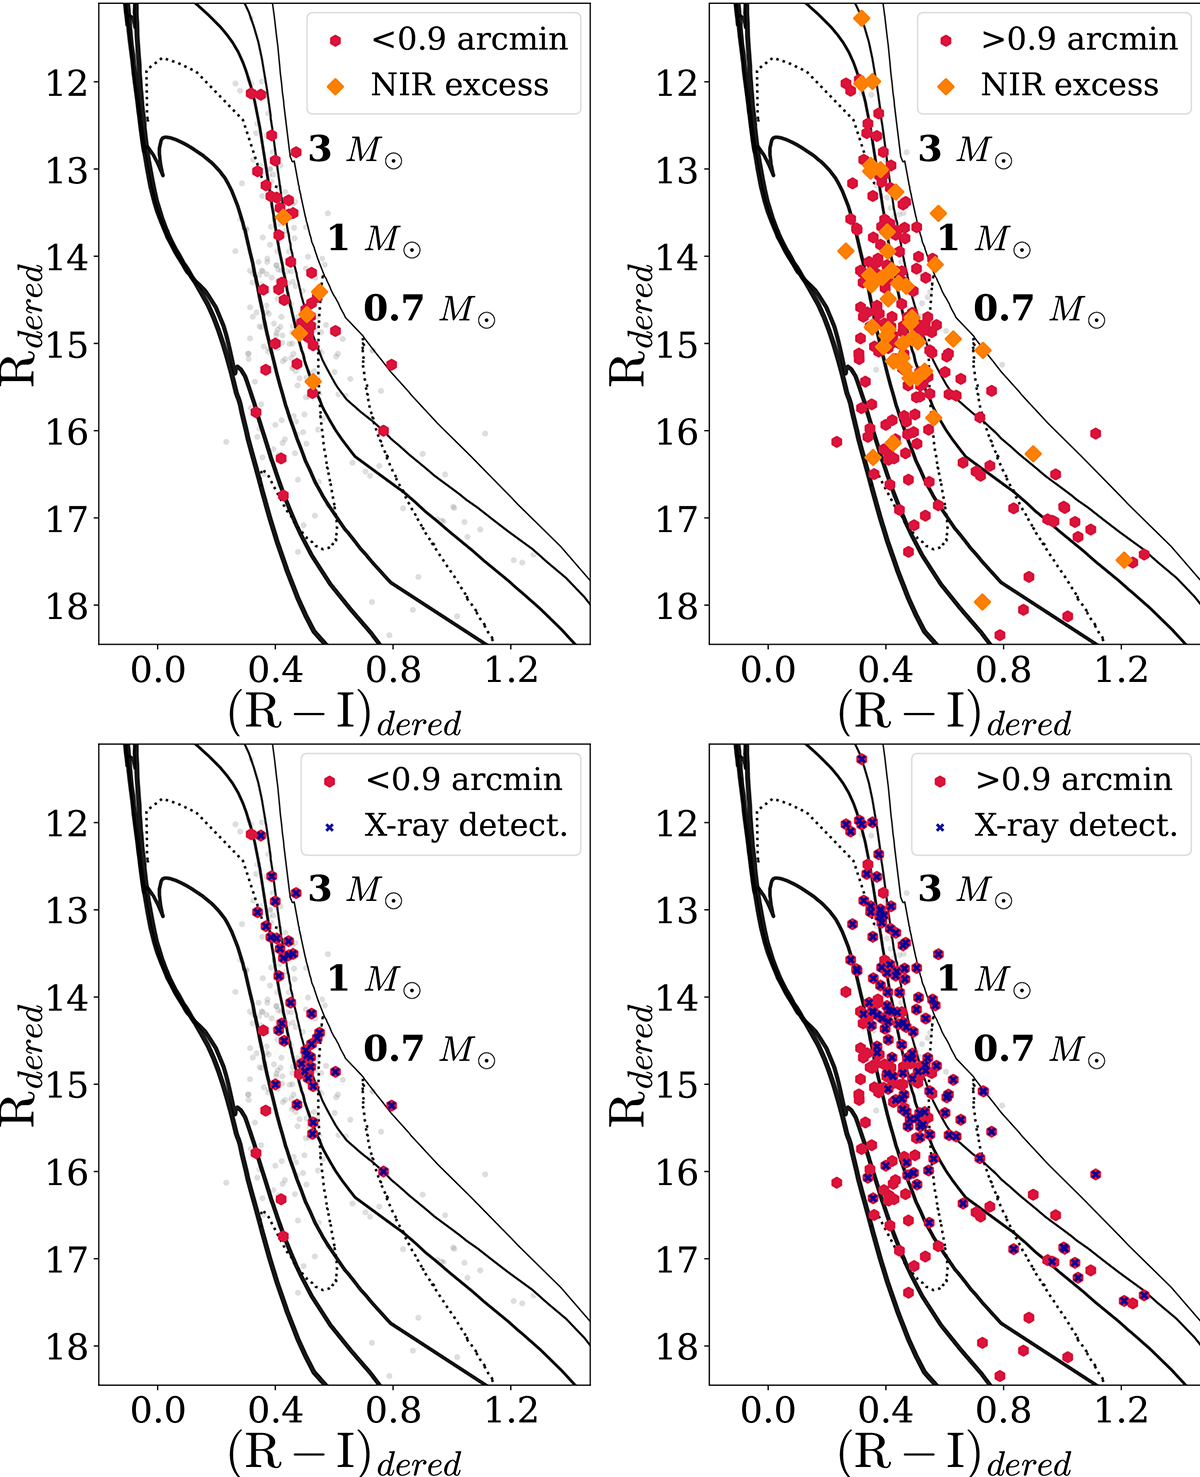
Fig. I.1.
Download original image
Colour-magnitude diagrams for de-reddened R and I band magnitudes from MUSE. Red hexagons mark stars within the core of Tr 14 (left, 0.9′, Kharchenko et al. 2013) or outside (right). The orange diamonds (top) indicate the NIR excess stars, while the dark blue crosses mark sources with a detected X-ray component (bottom, Townsley et al. 2011).
Current usage metrics show cumulative count of Article Views (full-text article views including HTML views, PDF and ePub downloads, according to the available data) and Abstracts Views on Vision4Press platform.
Data correspond to usage on the plateform after 2015. The current usage metrics is available 48-96 hours after online publication and is updated daily on week days.
Initial download of the metrics may take a while.