Open Access
Fig. H.2.
Download original image
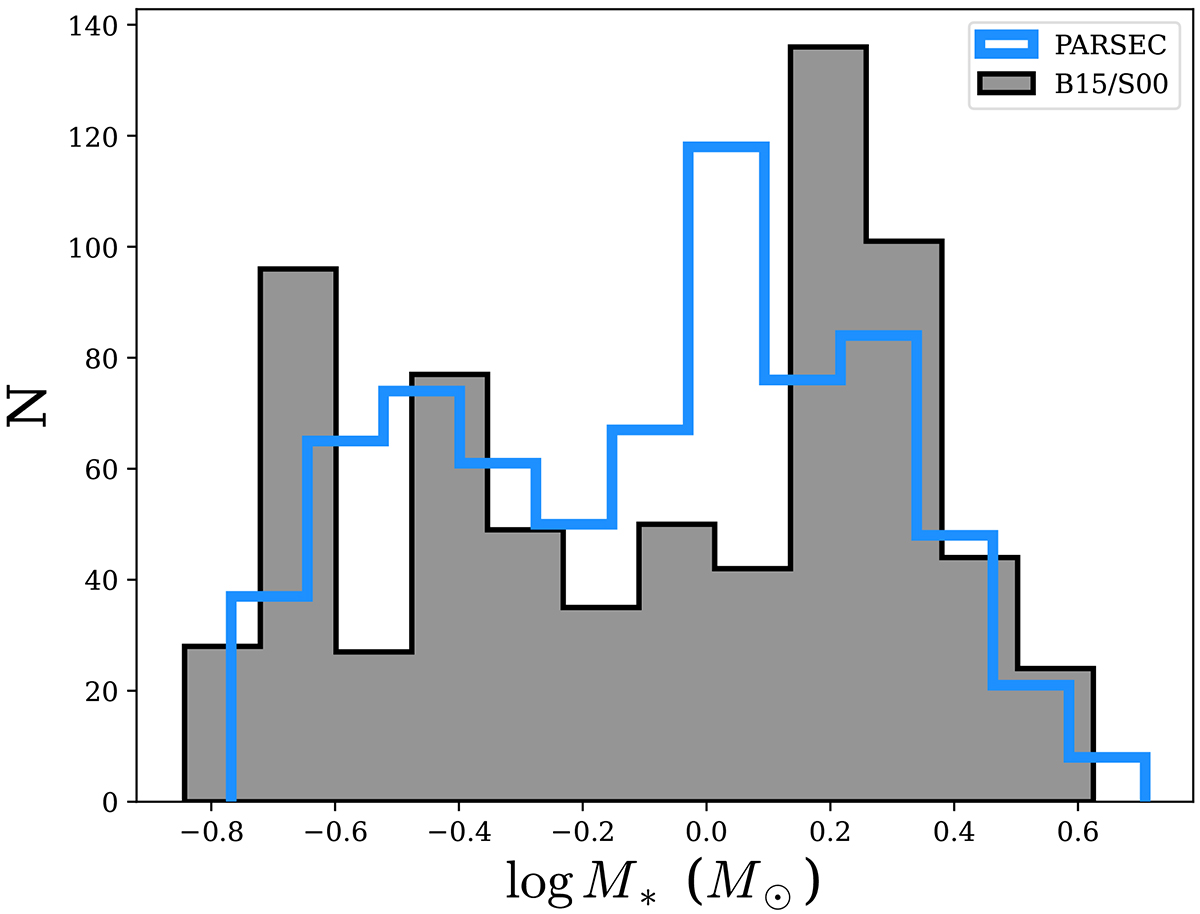
Distribution of all stellar masses from the final catalogue on a logarithmic scale. The black histogram filled with grey shows masses estimated based on evolutionary tracks from Baraffe et al. (2015) and Siess et al. (2000), while the open blue histogram shows stellar masses based on PARSEC models (Bressan et al. 2012).
Current usage metrics show cumulative count of Article Views (full-text article views including HTML views, PDF and ePub downloads, according to the available data) and Abstracts Views on Vision4Press platform.
Data correspond to usage on the plateform after 2015. The current usage metrics is available 48-96 hours after online publication and is updated daily on week days.
Initial download of the metrics may take a while.