Fig. 2.
Download original image
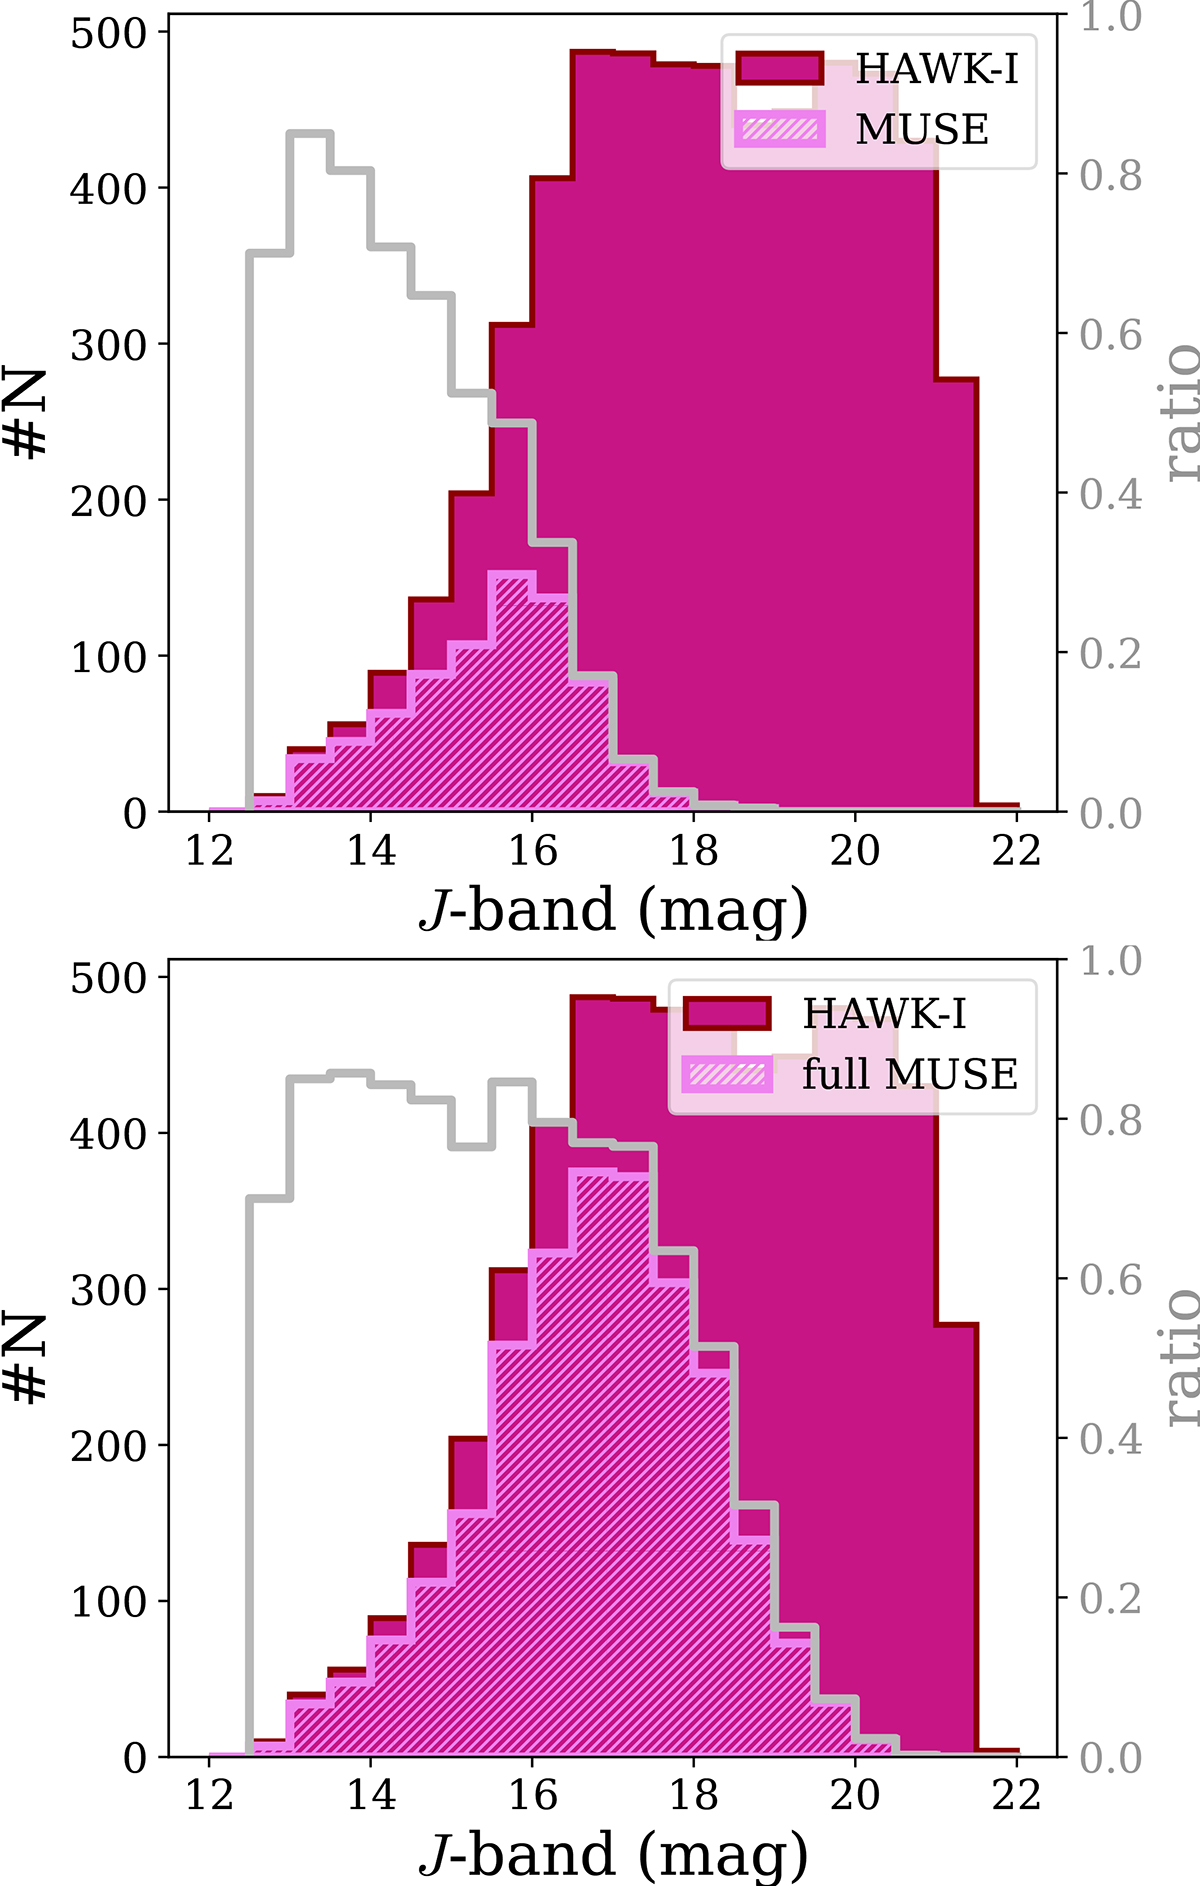
Distribution of J-band magnitudes from HAWK-I in the MUSE field (Preibisch et al. 2011a,b). The dark berry-coloured histogram shows all HAWK-I measurements taken in the same area that was covered by MUSE. The violet distribution presents point source detections from Sect. 2.2.6, (upper panel) and in combination with the one excluded due to the high background variation and foreground stars (lower panel). In both panels, the grey line shows the completeness of our catalogue, defined as a ratio of the number of stars in a given magnitude bin (0.5 mag wide) in our catalogue and in the HAWK-I catalogue.
Current usage metrics show cumulative count of Article Views (full-text article views including HTML views, PDF and ePub downloads, according to the available data) and Abstracts Views on Vision4Press platform.
Data correspond to usage on the plateform after 2015. The current usage metrics is available 48-96 hours after online publication and is updated daily on week days.
Initial download of the metrics may take a while.