Fig. 10.
Download original image
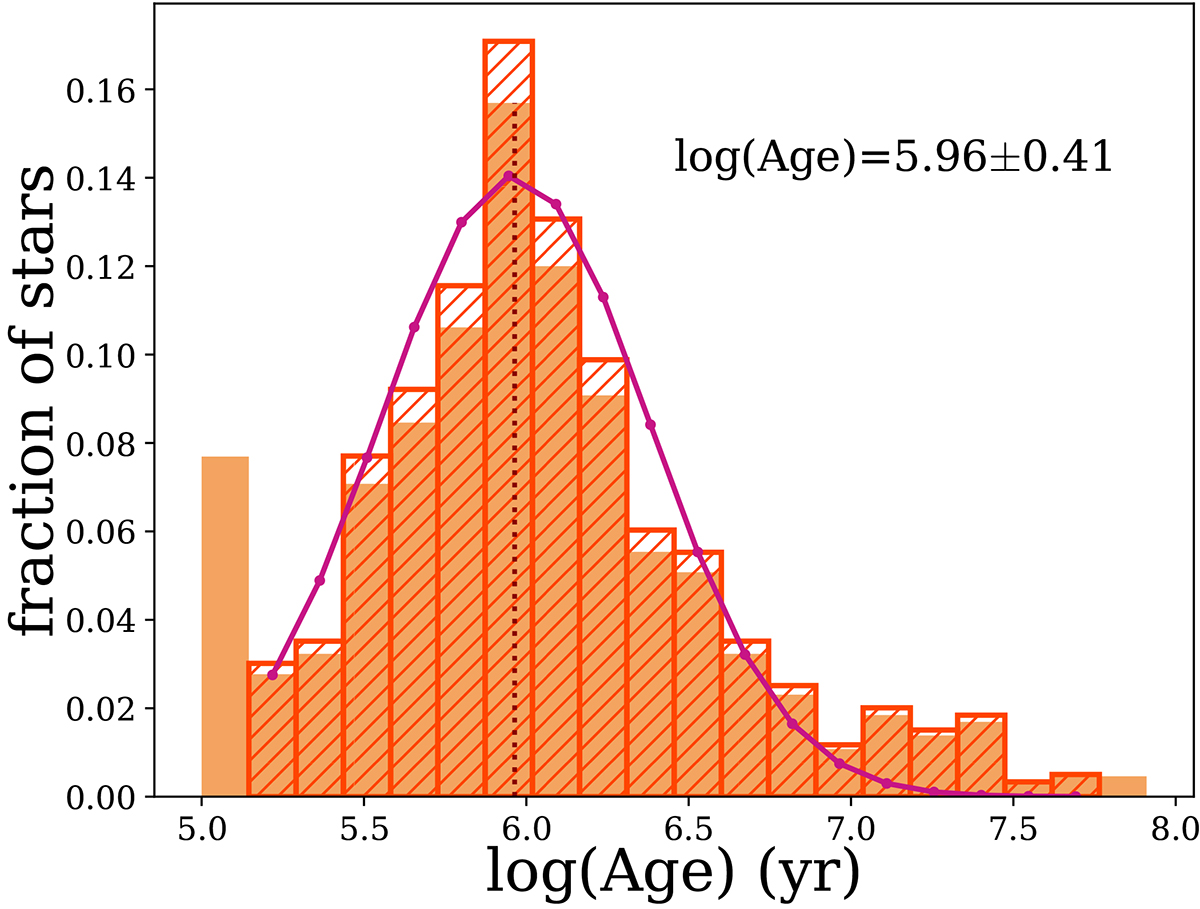
Fraction of stellar ages derived from HR diagram for stars with log(Teff) < 3.73. The filled orange histogram shows the distribution of the whole sample, while the hatched red histogram represents the fraction distribution after removing the extreme bars with respect to the total number of stars within the new age range. The normal fit to the probability density distribution converted into the fraction distribution for the visual purposes is shown as a dark violet curve with a mean value of log(age) = 5.96 ± 0.41, corresponding to the 0.9![]() Myr.
Myr.
Current usage metrics show cumulative count of Article Views (full-text article views including HTML views, PDF and ePub downloads, according to the available data) and Abstracts Views on Vision4Press platform.
Data correspond to usage on the plateform after 2015. The current usage metrics is available 48-96 hours after online publication and is updated daily on week days.
Initial download of the metrics may take a while.