Fig. 9
Download original image
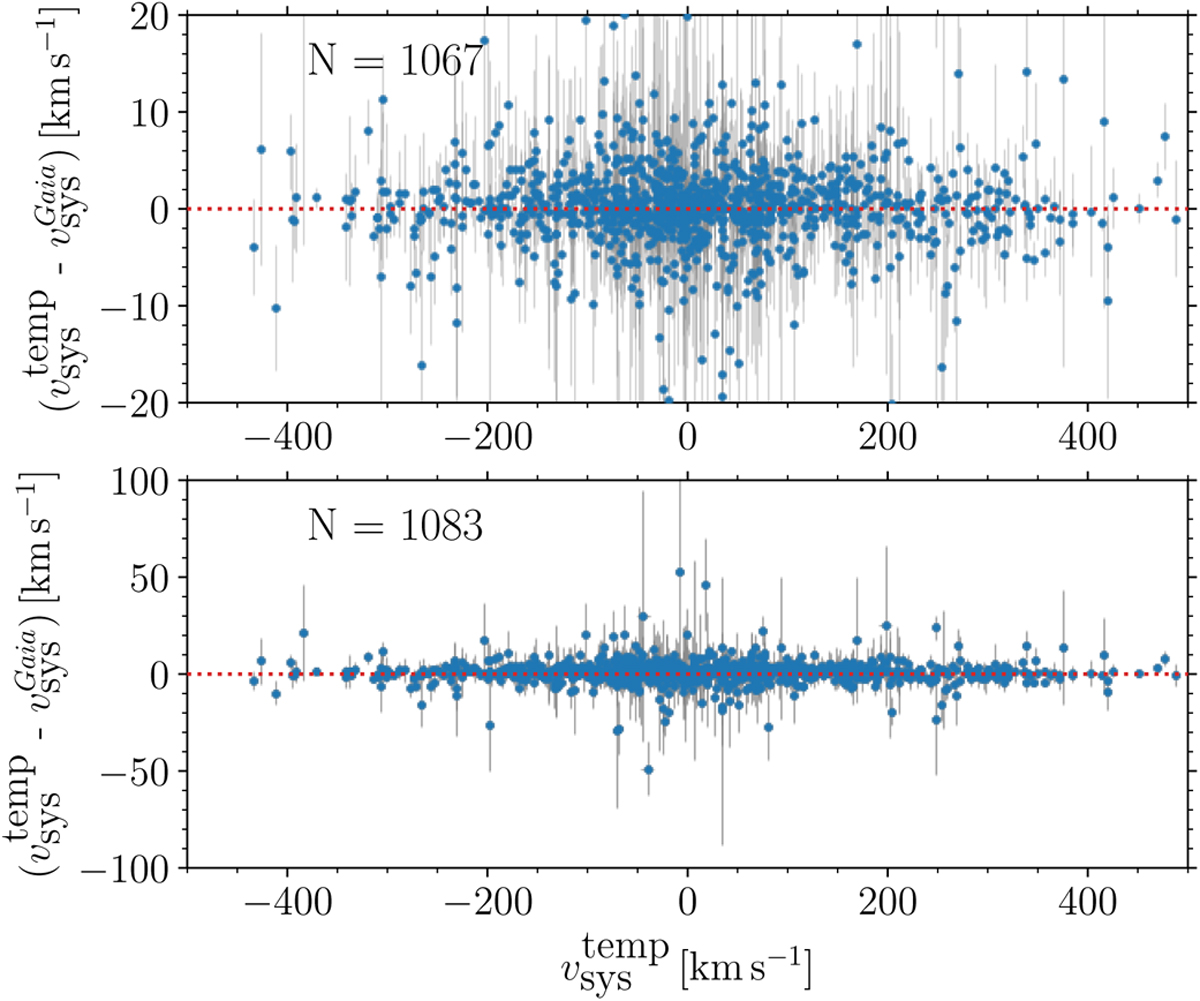
Comparison between Gaia-determined systemic velocities (Clementini et al. 2023) and our determined υsys using newly derived line-of-sight velocity templates and scaling relations. The top panel shows a zoom-in of the stars with the difference between Gaia and our values below |20| km s−1, while the bottom panel shows the entire scale. The numbers in each panel denote the total number of stars displayed in a given plot.
Current usage metrics show cumulative count of Article Views (full-text article views including HTML views, PDF and ePub downloads, according to the available data) and Abstracts Views on Vision4Press platform.
Data correspond to usage on the plateform after 2015. The current usage metrics is available 48-96 hours after online publication and is updated daily on week days.
Initial download of the metrics may take a while.