Fig. 8
Download original image
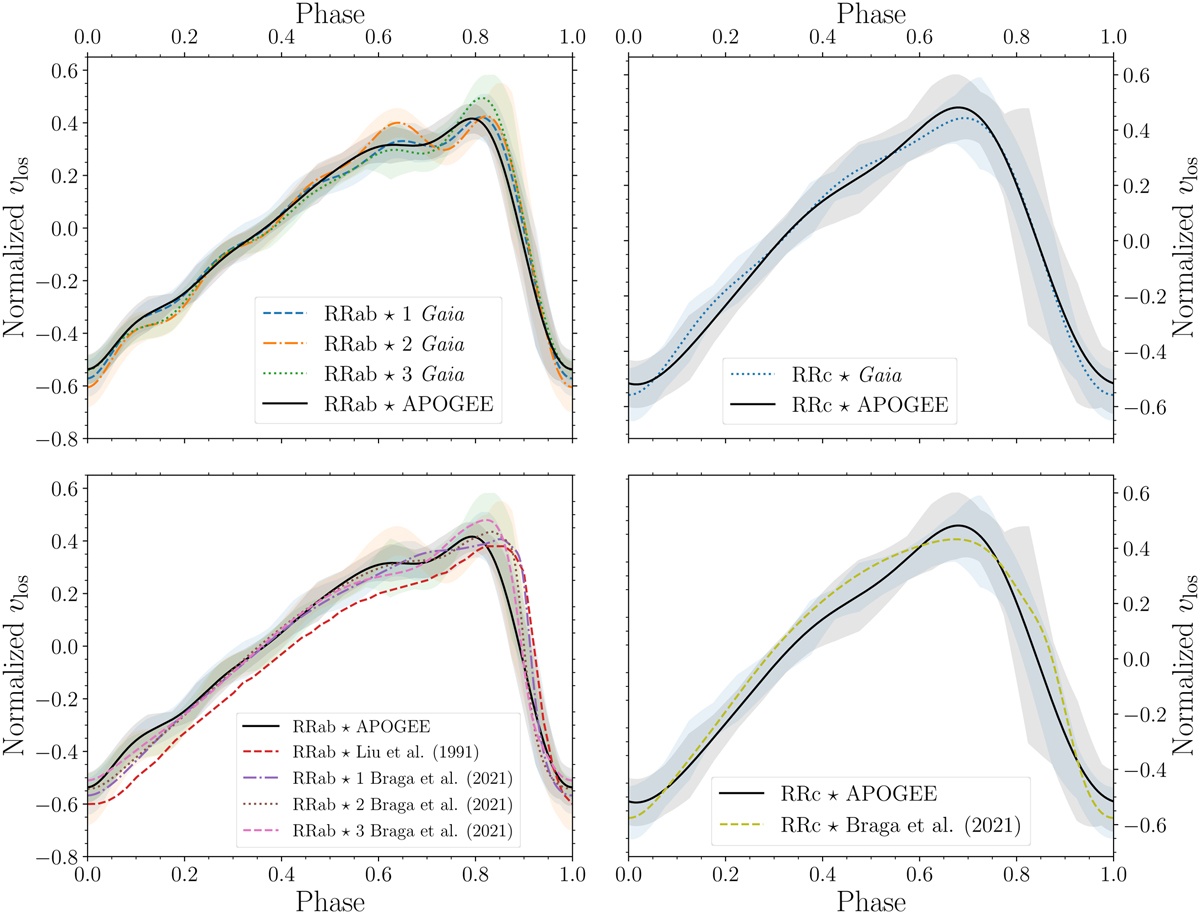
Comparison between line-of-sight velocity templates derived in this work (top panels, based on APOGEE and Gaia data) and those derived in previous studies (bottom panels, together with APOGEE line-of-sight velocity template). For each line-of-sight velocity template derived in this work, we also included a shaded region (in top and bottom panels) depicting the measured scatter along the template (see Tables A.3 and A.5).
Current usage metrics show cumulative count of Article Views (full-text article views including HTML views, PDF and ePub downloads, according to the available data) and Abstracts Views on Vision4Press platform.
Data correspond to usage on the plateform after 2015. The current usage metrics is available 48-96 hours after online publication and is updated daily on week days.
Initial download of the metrics may take a while.