Fig. 1
Download original image
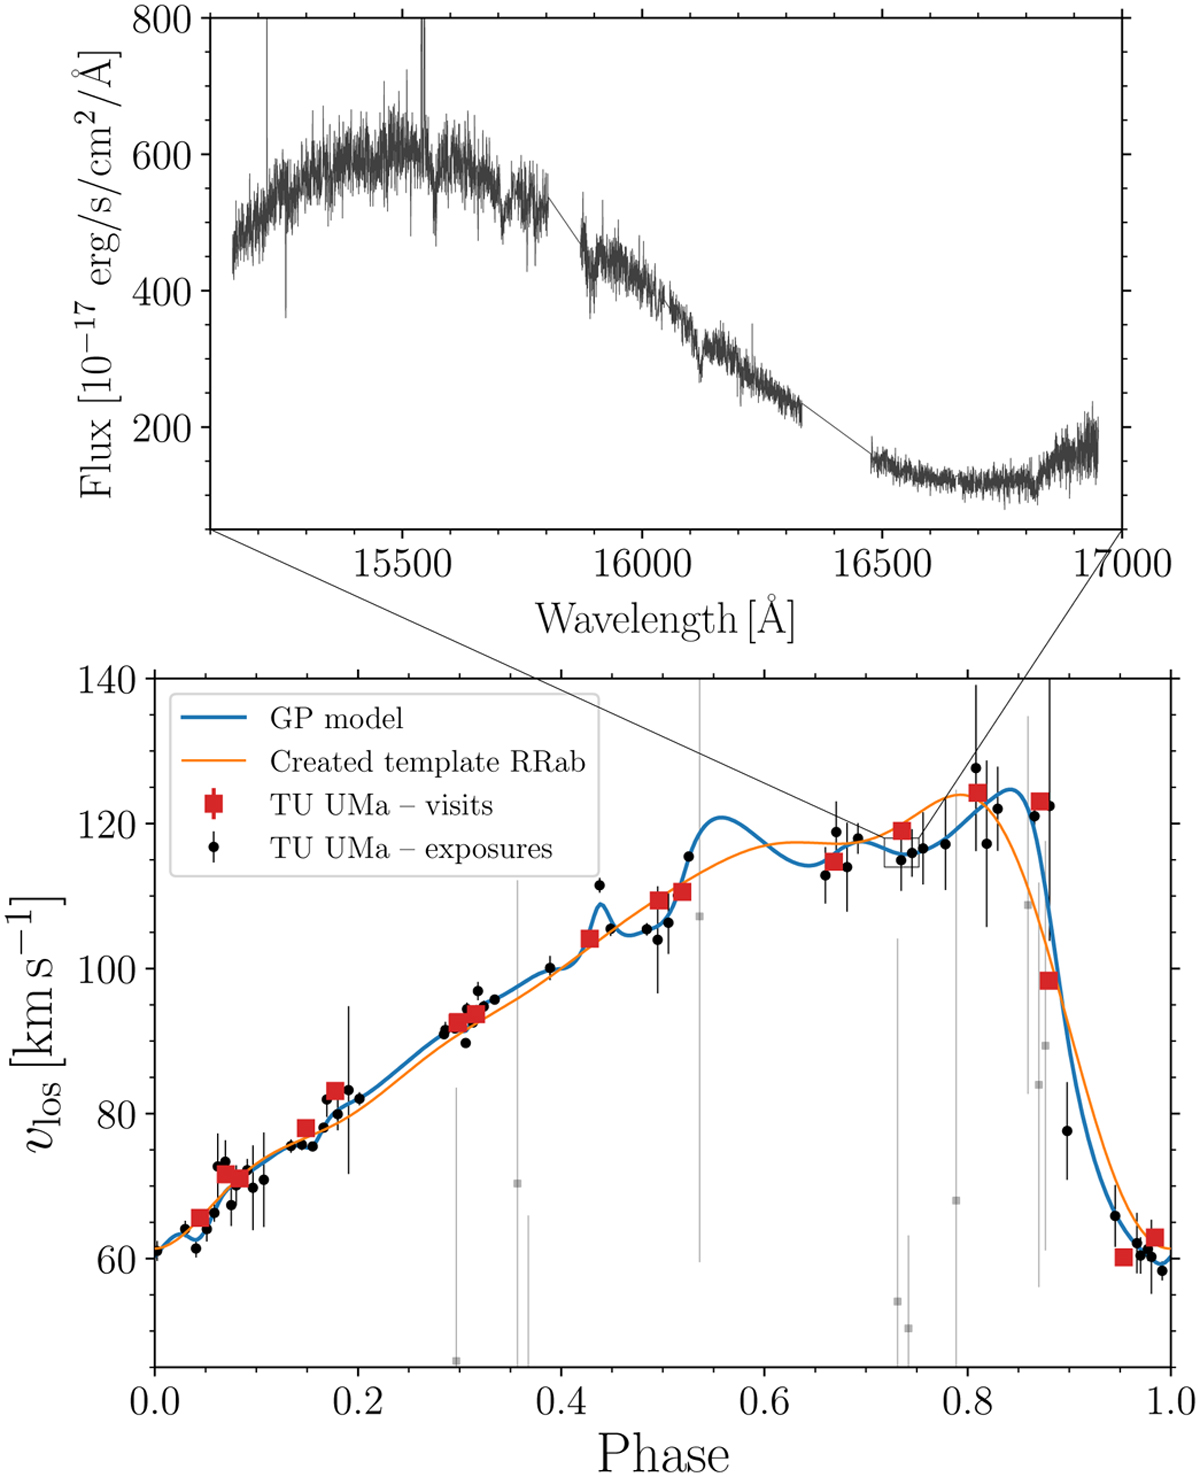
Example of a single exposure spectrum (top panel) and line-of-sight velocities (bottom panel) used in this work. The top panel depicts a spectrum of TU-UMa taken at HJD = 2 457 484.880667 day. The bottom panel shows the line-of-sight velocities derived in this work (black dots) and the velocities extracted from APOGEE data products (red squares). The gray dots represent estimated velocities that did not fulfill the criteria in Eq. (1).
Current usage metrics show cumulative count of Article Views (full-text article views including HTML views, PDF and ePub downloads, according to the available data) and Abstracts Views on Vision4Press platform.
Data correspond to usage on the plateform after 2015. The current usage metrics is available 48-96 hours after online publication and is updated daily on week days.
Initial download of the metrics may take a while.